
Folium地图标绘
folium是js上著名的地理信息可视化库leafet.js为Python提供的接口,通过它,我们可以通过在Python端编写代码操纵数据,来调用leaflet的相关功能,基于内建的osm或自行获取的osm资源和地图原件进行地理信息内容的可视化,以及制作优美的可交互地图,通过不断添加图层元素来定义一个Map对象,最后以几种方式将Map对象展现出来。
代码可以直接复制运行
import folium
from selenium import webdriver
import os
import time
from selenium.webdriver.chrome.options import Options
from docx import Document
from docx.shared import Inches
import docx
def report():
# create a map object with a desired initial map center and initial map zoom
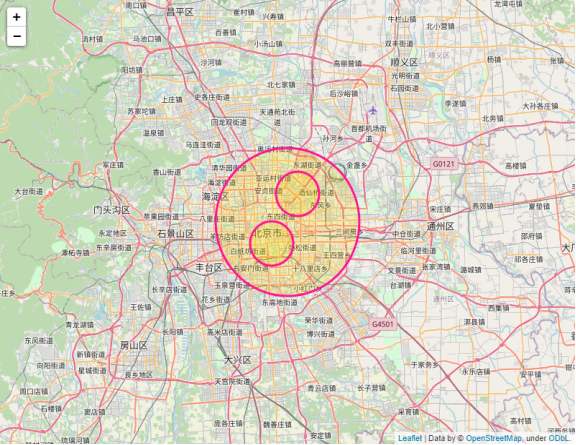
mapObj = folium.Map(location=[39.92, 116.43],
zoom_start=10,
# tiles='Stamen Toner',
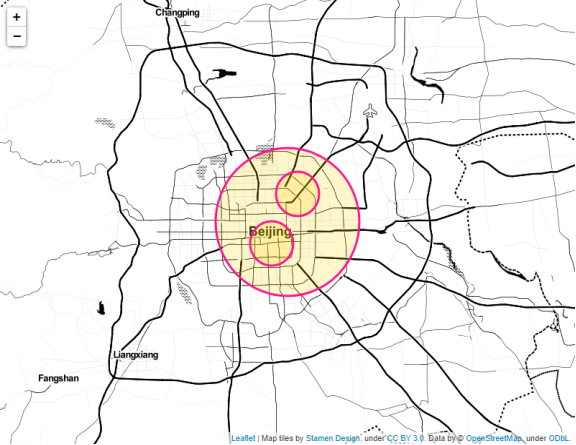
tiles='stamenwatercolor',
# tiles='OpenStreetMap'
)
# draw some circles
circlesData = [
[39.92, 116.43, 100],
[39.89, 116.40,30],
[39.96, 116.45,30]
]
for d in circlesData:
folium.CircleMarker(
location=tuple([d[0], d[1]]),
radius=d[2],
popup='AOI',
color='#FF1493',
fill=True,
fill_color='#FFD700'
).add_to(mapObj)
time.sleep(5)
# save the map as html
mapFname = 'output.html'
mapObj.save(mapFname)效果如下:
tiles='OpenStreetMap'
tiles='Stamen Toner'
本公众号只做干货,分享实际项目中的点点滴滴
希望您阅读后有所收获
同时,也希望您能在下方给个赞赏
您的赞赏
是我持续创作的最大动力!
非常感谢!

2、中国市级行政区shp(WGS84)【2022 · 最新数据共享】
4、IntelliJ IDEA 2022.3.1 专业版破解
9、Segment Anything 模型的 3 个地理空间和遥感用例
12、QGIS软件安装包下载


点分享

点点赞

点在看