import pandas as pd
defcalculate_demographic_data(print_data=True):# Read data from file
df = pd.read_csv('adult.data.csv')# How many of each race are represented in this dataset? This should be a Pandas series with race names as the index labels.
race_count = df['race'].value_counts()# What is the average age of men?
average_age_men =round(df[df['sex']=='Male']['age'].mean(),1)# What is the percentage of people who have a Bachelor's degree?
percentage_bachelors =round(df['education'].value_counts()['Bachelors']/len(df)*100,1)# What percentage of people with advanced education (`Bachelors`, `Masters`, or `Doctorate`) make more than 50K?# What percentage of people without advanced education make more than 50K?# with and without `Bachelors`, `Masters`, or `Doctorate`
higher_education = df[df['education'].isin(['Bachelors','Masters','Doctorate'])]
lower_education = df[~df['education'].isin(['Bachelors','Masters','Doctorate'])]# percentage with salary >50K
higher_education_rich =round(len(higher_education[higher_education['salary']=='>50K'])/len(higher_education)*100,1)
lower_education_rich =round(len(lower_education[lower_education['salary']=='>50K'])/len(lower_education)*100,1)# What is the minimum number of hours a person works per week (hours-per-week feature)?
min_work_hours = df['hours-per-week'].min()# What percentage of the people who work the minimum number of hours per week have a salary of >50K?
num_min_workers =len(df[(df['hours-per-week']==min_work_hours)])
rich_percentage =round(len(df[(df['hours-per-week']==min_work_hours)&(df['salary']=='>50K')])/num_min_workers*100,1)# What country has the highest percentage of people that earn >50K?
highest_earning_country =(df.loc[df["salary"]==">50K","native-country"].value_counts()/ df["native-country"].value_counts()).fillna(0).sort_values(ascending=False).index[0]
highest_earning_country_percentage =round(len(df[(df["native-country"]== highest_earning_country)&(
df["salary"]==">50K")])/len(df[df["native-country"]== highest_earning_country])*100,1)# Identify the most popular occupation for those who earn >50K in India.
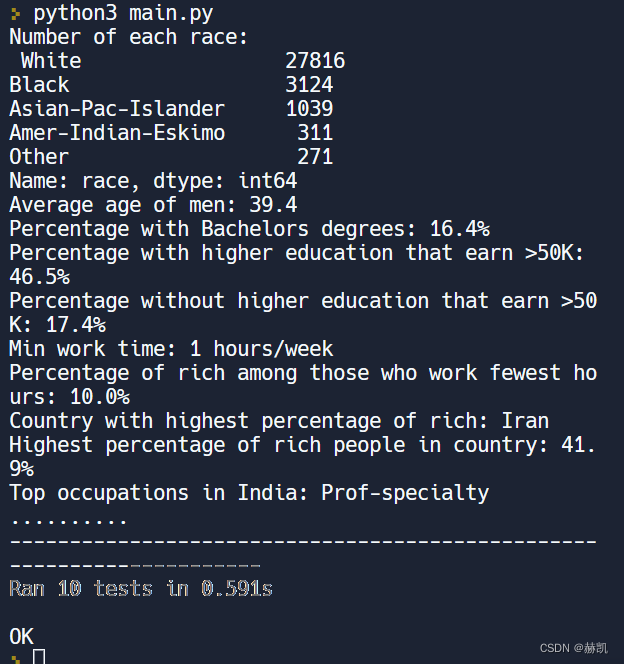
top_IN_occupation = df[(df['salary']=='>50K')&(df['native-country']=='India')]['occupation'].value_counts().index[0]# DO NOT MODIFY BELOW THIS LINEif print_data:print("Number of each race:\n", race_count)print("Average age of men:", average_age_men)print(f"Percentage with Bachelors degrees: {
percentage_bachelors}%")print(f"Percentage with higher education that earn >50K: {
higher_education_rich}%")print(f"Percentage without higher education that earn >50K: {
lower_education_rich}%")print(f"Min work time: {
min_work_hours} hours/week")print(f"Percentage of rich among those who work fewest hours: {
rich_percentage}%")print("Country with highest percentage of rich:", highest_earning_country)print(f"Highest percentage of rich people in country: {
highest_earning_country_percentage}%")print("Top occupations in India:", top_IN_occupation)return{
'race_count': race_count,'average_age_men': average_age_men,'percentage_bachelors': percentage_bachelors,'higher_education_rich': higher_education_rich,'lower_education_rich': lower_education_rich,'min_work_hours': min_work_hours,'rich_percentage': rich_percentage,'highest_earning_country': highest_earning_country,'highest_earning_country_percentage':
highest_earning_country_percentage,'top_IN_occupation': top_IN_occupation
}