#这是为了把dota类型的标注转为coco的正框标注
#原因是要做一个车辆检测,coco格式标注,但是dota更适合用来训练
#下面是代码
#一些模块为了后面的可视化而增加
import os.path as osp
import os
from PIL import Image
import json
from matplotlib import pyplot as plt
#根据信息生成模板,此处要求bbox必须是xyxy标注
def coco_annotations(bbox,cid,bbox_id,img_id,iscrowd):
    x1,y1,x2,y2=bbox
    return {

    'segmentation':[[x1,y1,x2,y1,x2,y2,x1,y2]],
           'bbox':[x1,y1,x2-x1+1,y2-y1+1],
           'category_id':cid,
           'area':(y2-y1+1)*(x2-x1+1),
           'iscrowd':iscrowd,
           'image_id':img_id,
           'id':bbox_id}
def coco_images(file_name,height,width,img_id):
    return {

    'file_name':file_name,
           'height':height,
           'width':width,
           'id':img_id}

#从dota数据集中的txt格式标注中获取信息,函数中需要用到变量cls_name2id,categories
def deal_with_txt(label_path, img_id, anno_id):
    annos = []

    with open(label_path,'r') as gt:
        gt_lines=gt.readlines()
    for i in gt_lines:
        iscrowd=int(i[-2])
        i=i.split(' ')
        cls_name=i[-2]
        cid=cls_name2id[cls_name]

        cood=i[:8]
        cood=tuple(map(float,cood))
        x1=min(cood[0],cood[2],cood[4],cood[6])
        x2=max(cood[0],cood[2],cood[4],cood[6])
        y1=min(cood[1],cood[3],cood[5],cood[7])
        y2=max(cood[1],cood[3],cood[5],cood[7])
        b=(x1,y1,x2,y2)
        #下面使用coco_annotations函数把上面的读取数据输入
        anno=coco_annotations(b,cid,anno_id,img_id,iscrowd)
        annos.append(anno)
        anno_id+=1
    return annos,anno_id


def generate_coco_fmt(data_root,anno_root,categories,img_root):
    '''
    data_root是数据集路径
    下面的路径是相对data_root的路径
    anno_root是数据集的标注文件的路径
    img_root是数据集的图片路径

    categories需要事先得到
    '''
    img_id, anno_id = 0, 0
    all_annos, all_images = [], []

    for anno_txt in os.listdir(osp.join(data_root,anno_root)):
        file_name=anno_txt.replace('txt','png')
        label_path=osp.join(data_root,anno_root,anno_txt)
        img_path=osp.join(data_root,img_root,file_name)
        if osp.exists(img_path):
            annos,anno_id=deal_with_txt(label_path,img_id,anno_id)
            all_annos.extend(annos)

            img=Image.open(img_path)
            all_images.append(coco_images(osp.join(img_root,file_name),img.height,img.width,img_id))
            img_id+=1
    return{


        'images':all_images,
        "annotations": all_annos,
        "categories": categories,
        "type": "instance"
    }
'''
	这一部分的目的是为了获取必须提前获取的categories和cls_name2id
'''
classes=('plane', 'baseball-diamond', 'bridge', 'ground-track-field',
               'small-vehicle', 'large-vehicle', 'ship', 'tennis-court',
               'basketball-court', 'storage-tank', 'soccer-ball-field',
               'roundabout', 'harbor', 'swimming-pool', 'helicopter')
cls_name2id={

    }
categories=[]
for i in range(1,16):
    cls_name2id.update({

    classes[i-1]:i})
    dict_cate={

    'id':i,'name':classes[i-1],'supercategory':classes[i-1]}
    categories.append(dict_cate)
#路径自己改一下记得
data_root='../data/DOTA1-split-1024'
anno_root='trainval1024/annfiles'
img_root='trainval1024/images'
dota_coco_fmt=generate_coco_fmt(data_root,anno_root,categories,img_root)
json.dump(dota_coco_fmt,open(osp.join(data_root,'train.json'),'a'),ensure_ascii=False)
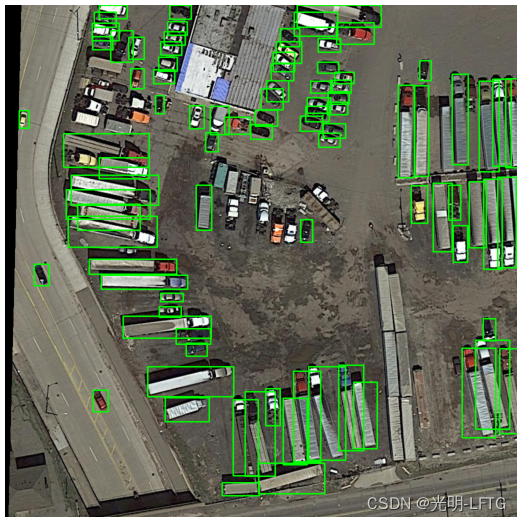
效果图:
原始的txt的包含信息:
[‘597.0 429.0 614.0 432.0 608.0 473.0 591.0 470.0 small-vehicle 1\n’,
‘409.0 647.0 410.0 667.0 343.0 677.0 342.0 658.0 small-vehicle 0\n’,
‘434.0 959.0 505.0 955.0 507.0 978.0 436.0 980.0 large-vehicle 0\n’,
‘697.0 757.0 718.0 754.0 743.0 881.0 721.0 886.0 large-vehicle 0\n’,
‘556.0 790.0 580.0 786.0 603.0 913.0 578.0 918.0 large-vehicle 0\n’,
‘521.0 772.0 544.0 767.0 549.0 837.0 528.0 840.0 small-vehicle 0\n’,
‘456.0 790.0 479.0 789.0 505.0 939.0 483.0 940.0 large-vehicle 0\n’,
‘480.0 781.0 503.0 773.0 539.0 929.0 509.0 941.0 large-vehicle 0\n’,
‘607.0 729.0 633.0 723.0 680.0 898.0 647.0 909.0 large-vehicle 0\n’,
‘390.0 360.0 412.0 364.0 409.0 449.0 382.0 446.0 large-vehicle 0\n’,
‘751.0 21.0 747.0 43.0 584.0 0.0 669.0 0.0 large-vehicle 0\n’,]
以及可视化后的图片:
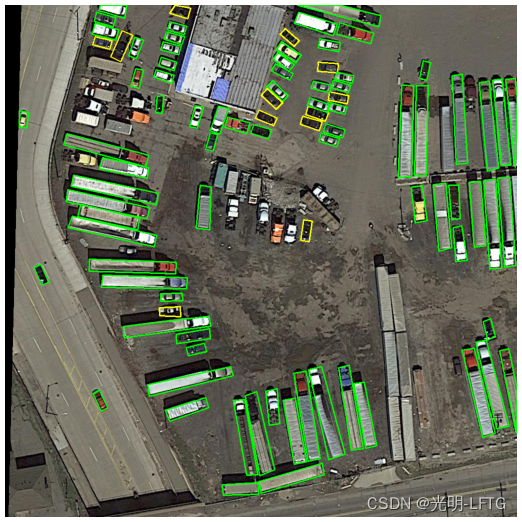
当然,由于coco的格式是所有标注统一在一起的json文件,这里没法展示:
于是展示一下,正框可视化后的结果。
如果想知道可视化代码可以去我的历史文章里面看。
如果自己写可视化的话,使用opencv比Image模块要方便很多,Image模块需要numpy之间转来转去,opencv有很多内置函数,记不得了上网搜索很方便,而且opencv还支持标注框附带文字。