-
npm下载echarts
-
项目中引入
import * as echarts from "echarts"; -
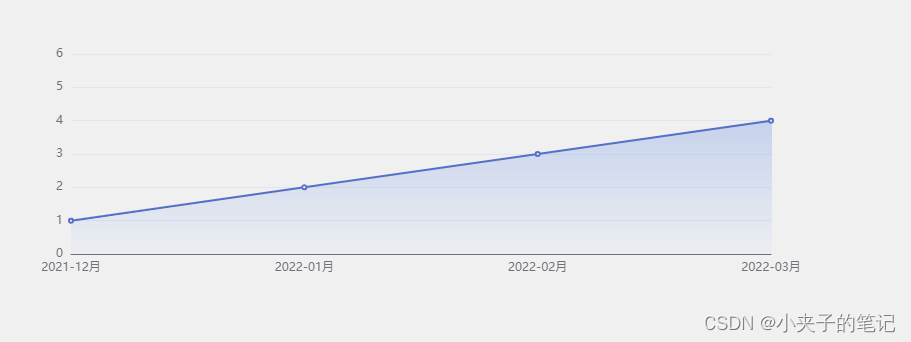
完成效果:
-
代码
// An highlighted block
<template>
  <div ref="container" :style="{ width: '90%', height: '100%' }"></div>
</template>
<script>
import * as echarts from "echarts";
import {

     onMounted, ref } from "vue";
export default {


  setup() {


    const container = ref(null);
    onMounted(() => {


      const chart = echarts.init(container.value, {


        width: "700px",
        height: "200px",
      });
        chart.setOption({


          xAxis: {


            type: "category",
            boundaryGap: false,
            data: [1,2,3,4],
            axisLabel: {


              formatter: "{value}月",
            },
            axisTick: {


              length: 0,
            },
          },
          yAxis: {


            type: "value",
          },
          series: [
            {


              data: [1, 2, 3, 4]
              type: "line",

              areaStyle: {


                color: new echarts.graphic.LinearGradient(0, 0, 0, 1, [
                  {


                    offset: 0,
                    color: "rgba(67, 119, 222, 0.5)",
                  },
                  {


                    offset: 1,
                    color: "rgba(67, 119, 222, 0.03)",
                  },
                ]),
              },
            },
          ],
        });

      window.addEventListener("resize", () => chart.resize(), false);
    });

    return {

     container };
  },
};
</script>