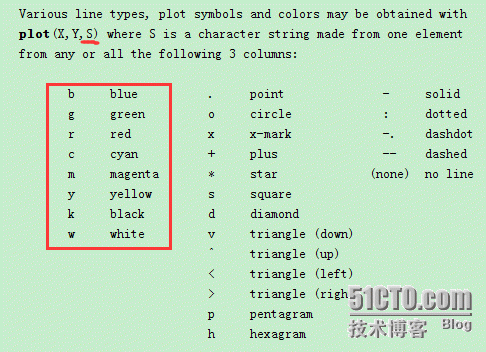
Plot是matlab里常用的命令~
可以通过help plot来查询关于plot绘图的相关命令
- help plot
推荐大家自己画画图测试一下~
而且这些命令是可以叠加使用的。即
- plot(x,y,'bo');
可以画出蓝色的圆圈形状图线。
除了matlab自带的这8种颜色,如果需要更丰富的颜色画线,可以使用'color'参数来自定义线条颜色,可以参考这篇博客园的文章。
http://www.cnblogs.com/takeaction/p/3789871.html
那么问题来了,如果采用'color'参数来制定RGB颜色的话只能得到实线,如果我希望用自定义颜色来实现不同线型,即RGB与线型结合的话,该如何实现呢?
一开始我类比之前的办法,在(注意matlab中color的rgb值为0到1,对应于标准的RGB图像值0-255需要在其后除以255)
- plot(x,y,'coloro',[0 1 0]);
或者
- plot(x,y,'color',[0 1 0],'o');
均不能达到目的
后来发现把线型参数放到‘color’之前可以实现我的目的,即
- plot(x,y,'o','color',[0 1 0]);
这样就会发现你的matlab可以实现各种颜色咯!
下面~画一个光盘反面好了。
- qpskConstellation = [-1+1i 1+1i; -1-1i 1-1i]/sqrt(2);
- qpsk = reshape(qpskConstellation,1,[]);
- Num = 40;
- outter = 60;
- for nn = 1:outter
- qpsk = qpsk * (outter-1)/outter;
- c = rand(Num,3); %随机生成了12种颜色。RGB随机。
- for idx = 1:Num
- theta = pi/2/Num*idx;
- rou = [cos(theta) sin(theta);sin(theta) -cos(theta)];
- realPart = real(qpsk);
- imagPart = imag(qpsk);
- reim = rou * [realPart;imagPart];
- realPart2 = real(qpsk*0.3);
- imagPart2 = imag(qpsk*0.3);
- reim2 = rou * [realPart2;imagPart2];
- plot(reim(1,:),reim(2,:),'o','color',c(idx,:));
- hold on;
- plot(reim2(1,:),reim2(2,:),'.','color',c(idx,:));
- hold on;
- pause(0.005);
- end
- end
复制运行一下。嘿嘿~
