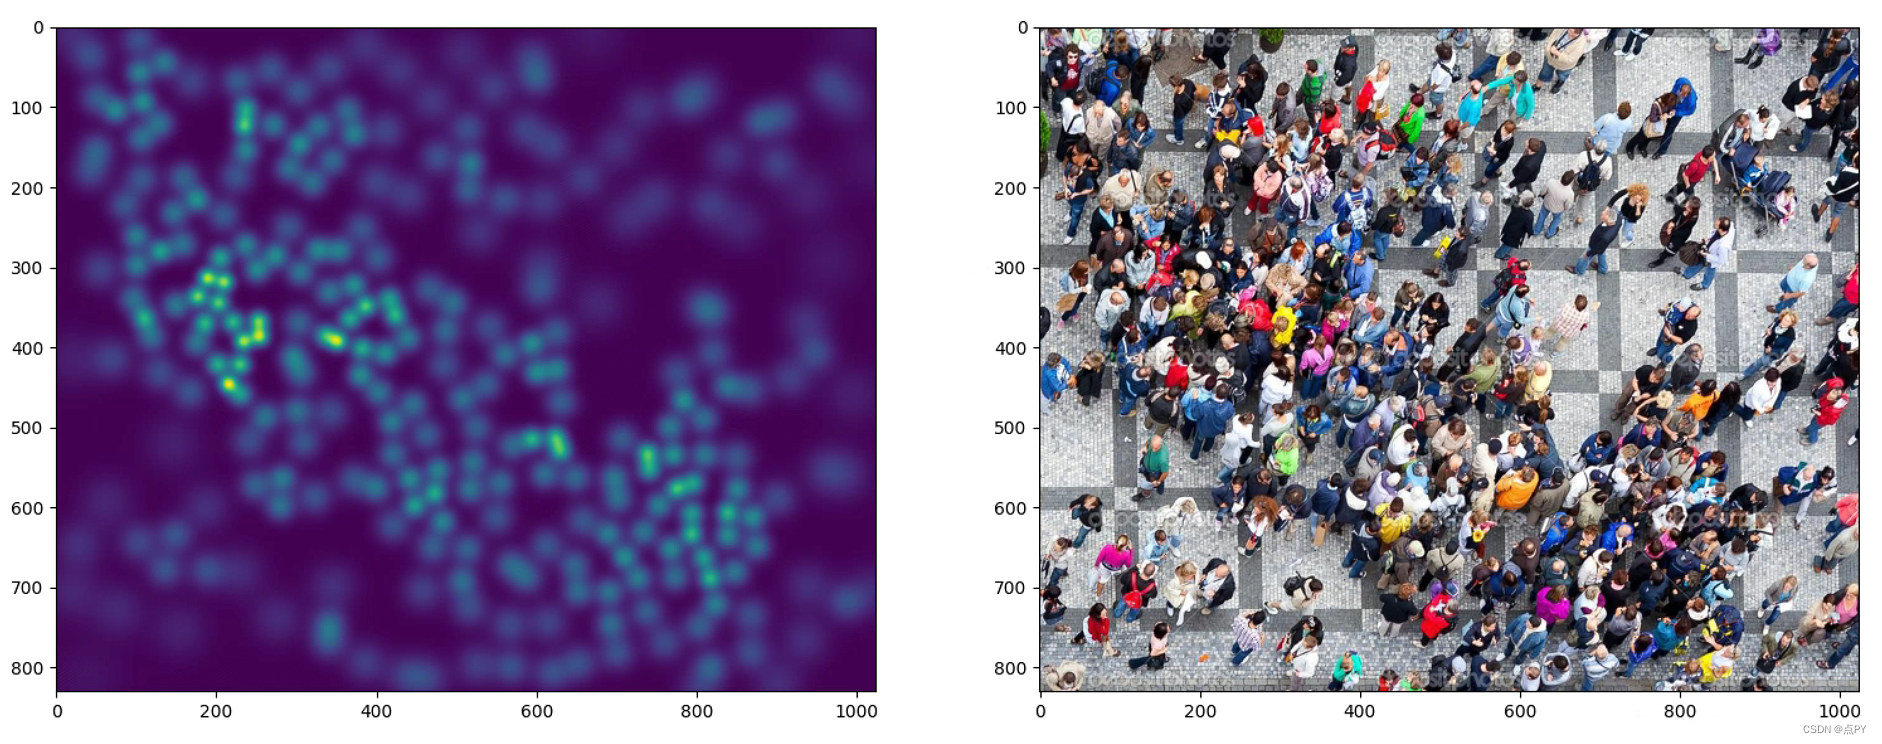
过程
首先构造一个和原始图片大小相同的矩阵,并将其全部置为0,然后将每个被标记的人头对应的位置置为1,这样就得到了一个只有0和1的矩阵,最后通过高斯核函数进行卷积得到一个连续的密度图。
代码
import h5py
import scipy.io as io
import PIL.Image as Image
import numpy as np
import os
import glob
from matplotlib import pyplot as plt
from scipy.ndimage.filters import gaussian_filter
from scipy.spatial import KDTree
import scipy
import json
from matplotlib import cm as CM
import torch

#this is borrowed from https://github.com/davideverona/deep-crowd-counting_crowdnet
def gaussian_filter_density(gt):
    print(gt.shape)
    density = np.zeros(gt.shape, dtype=np.float32)
    gt_count = np.count_nonzero(gt)
    if gt_count == 0:
        return density

    pts = np.array(list(zip(np.nonzero(gt)[1], np.nonzero(gt)[0])))
    leafsize = 2048
    # build kdtree
    tree =  KDTree(pts.copy(), leafsize=leafsize)
    # query kdtree
    distances, locations = tree.query(pts, k=4)

    print('generate density...')
    for i, pt in enumerate(pts):
        pt2d = np.zeros(gt.shape, dtype=np.float32)
        pt2d[pt[1],pt[0]] = 1.
        if gt_count > 1:
            sigma = (distances[i][1]+distances[i][2]+distances[i][3])*0.1
        else:
            sigma = np.average(np.array(gt.shape))/2./2. #case: 1 point
        density += scipy.ndimage.filters.gaussian_filter(pt2d, sigma, mode='constant')
    print('done.')
    return density

if __name__ == "__main__":
    #set the root to the Shanghai dataset you download
    root = r'D:\dl_dataset\object_counting\ShanghaiTech_Crowd_Counting_Dataset'
    #now generate the ShanghaiA's ground truth
    part_A_train = os.path.join(root,'part_A_final/train_data','images')
    part_A_test = os.path.join(root,'part_A_final/test_data','images')
    part_B_train = os.path.join(root,'part_B_final/train_data','images')
    part_B_test = os.path.join(root,'part_B_final/test_data','images')
    path_sets = [part_A_train,part_A_test]

    img_paths = []
    for path in path_sets:
        for img_path in glob.glob(os.path.join(path, '*.jpg')):
            img_paths.append(img_path)

    for img_path in img_paths:
        print(img_path)
        mat = io.loadmat(img_path.replace('.jpg','.mat').replace('images','ground_truth').replace('IMG_','GT_IMG_'))
        img= plt.imread(img_path)
        k = np.zeros((img.shape[0],img.shape[1]))
        gt = mat["image_info"][0,0][0,0][0]
        for i in range(0,len(gt)):
            if int(gt[i][1])<img.shape[0] and int(gt[i][0])<img.shape[1]:
                k[int(gt[i][1]),int(gt[i][0])]=1
        k = gaussian_filter_density(k)
        # plt.subplot(121)
        # plt.imshow(k)
        # plt.subplot(122)
        # plt.imshow(img)
        # plt.show()

        with h5py.File(img_path.replace('.jpg','.h5').replace('images','ground_truth'), 'w') as hf:
                hf['density'] = k

    # #now see a sample from ShanghaiA
    plt.imshow(Image.open(img_paths[0]))
    gt_file = h5py.File(img_paths[0].replace('.jpg','.h5').replace('images','ground_truth'),'r')
    groundtruth = np.asarray(gt_file['density'])
    plt.imshow(groundtruth,cmap=CM.jet)

    #now generate the ShanghaiB's ground truth
    path_sets = [part_B_train,part_B_test]

    img_paths = []
    for path in path_sets:
        for img_path in glob.glob(os.path.join(path, '*.jpg')):
            img_paths.append(img_path)

    for img_path in img_paths:
        print(img_path)
        mat = io.loadmat(img_path.replace('.jpg','.mat').replace('images','ground_truth').replace('IMG_','GT_IMG_'))
        img= plt.imread(img_path)
        k = np.zeros((img.shape[0],img.shape[1]))
        gt = mat["image_info"][0,0][0,0][0]
        for i in range(0,len(gt)):
            if int(gt[i][1])<img.shape[0] and int(gt[i][0])<img.shape[1]:
                k[int(gt[i][1]),int(gt[i][0])]=1
        k = gaussian_filter(k,15)
        with h5py.File(img_path.replace('.jpg','.h5').replace('images','ground_truth'), 'w') as hf:
                hf['density'] = k
参考
https://github.com/leeyeehoo/CSRNet-pytorch/blob/master/make_dataset.ipynb