文中若有代码、术语等错误,欢迎指正
055介绍Profiling
前言
- 此节目的
- 为了在自己的程序中知道具体代码段的耗时情况
- 如何很早知道这段代码应该被优化
- 所以需要手动制作一个简单的监控程序
代码
-
思路
一个Timer类,在程序段中Timer t;声明代表构造,程序段结束调用析构函数,从而知道析构和构造这一段所耗时间。
#include "Sandbox2D.h"
#include "imgui/imgui.h"

#include <glm/gtc/matrix_transform.hpp>
#include <glm/gtc/type_ptr.hpp>

#include <Hazel/Renderer/Renderer2D.h>

#include <chrono>
#include <string>
template<typename Fn>
class Timer {


public:
	Timer(const char* name, Fn&& func)
		:m_Name(name), m_Func(func), m_Stopped(false)
	{


		m_StartTimepoint = std::chrono::high_resolution_clock::now();
	}
	~Timer() {


		if (!m_Stopped) {


			Stop();
		}
	}
	void Stop() {


		auto endTimepoint = std::chrono::high_resolution_clock::now();
		// microseconds 是微秒
		long long start = std::chrono::time_point_cast<std::chrono::microseconds>(m_StartTimepoint).time_since_epoch().count();
		long long end = std::chrono::time_point_cast<std::chrono::microseconds>(endTimepoint).time_since_epoch().count();

		m_Stopped = true;

		float duration = (end - start) * 0.001f;
		// 执行函数
		m_Func({

       m_Name, duration });
	}
private:
	const char* m_Name;
	Fn m_Func;
	std::chrono::time_point<std::chrono::steady_clock> m_StartTimepoint;
	bool m_Stopped;
};
#define PROFILE_SCOPE(name) Timer timer##__LINE__(name, [&](ProfileResult profileResult){

         m_ProfileResults.push_back(profileResult);})

Sandbox2D::Sandbox2D() : Layer("Sandbox2D"), m_CameraController(1280.0f / 720.0f, true){

      }
void Sandbox2D::OnAttach(){


	//Hazel::Renderer2D::Init();
	m_SquareTexture = Hazel::Texture2D::Create("assets/textures/Checkerboard.png");
}
void Sandbox2D::OnDetach(){

      }
Sandbox2D::~Sandbox2D(){

      }
// 捕捉函数段所耗时
void Sandbox2D::OnUpdate(Hazel::Timestep ts){


	PROFILE_SCOPE("Sandbox2D::OnUpdate");
	{


		PROFILE_SCOPE("Sandbox2D::OnUpdate");
		m_CameraController.OnUpdate(ts);
	}

	{


		PROFILE_SCOPE("Renderer::Prep");
		Hazel::RenderCommand::SetClearColor({

       0.1f, 0.1f, 0.1f, 1 });
		Hazel::RenderCommand::Clear();
	}
	{


		PROFILE_SCOPE("Renderer::Draw");
		Hazel::Renderer2D::BeginScene(m_CameraController.GetCamera());
		Hazel::Renderer2D::DrawQuad({

      -1.0f, 0.0f}, {

      0.8f,0.8f}, m_FlatColor);
		Hazel::Renderer2D::DrawQuad({

       0.5f, -0.5f }, {

       0.5f, 0.8f }, {

      0.2f, 0.8f, 0.9f, 1.0f});
		Hazel::Renderer2D::DrawQuad({

       0.0f, 0.0f, -0.1f }, {

       10.0f, 10.0f }, m_SquareTexture);
		Hazel::Renderer2D::EndScene();
	}
}
void Sandbox2D::OnImgGuiRender(){


	ImGui::Begin("Settings");
	ImGui::ColorEdit4("Square Color", glm::value_ptr(m_FlatColor));
	// 在Imgui窗口上显示耗时
	for (auto& result : m_ProfileResults) {


		char label[50];
		strcpy(label, "%.3fms ");
		strcat(label, result.Name);
		ImGui::Text(label, result.Time);
	}
	m_ProfileResults.clear();

	ImGui::End();
}
void Sandbox2D::OnEvent(Hazel::Event& event){


	// 事件
	m_CameraController.OnEvent(event);
}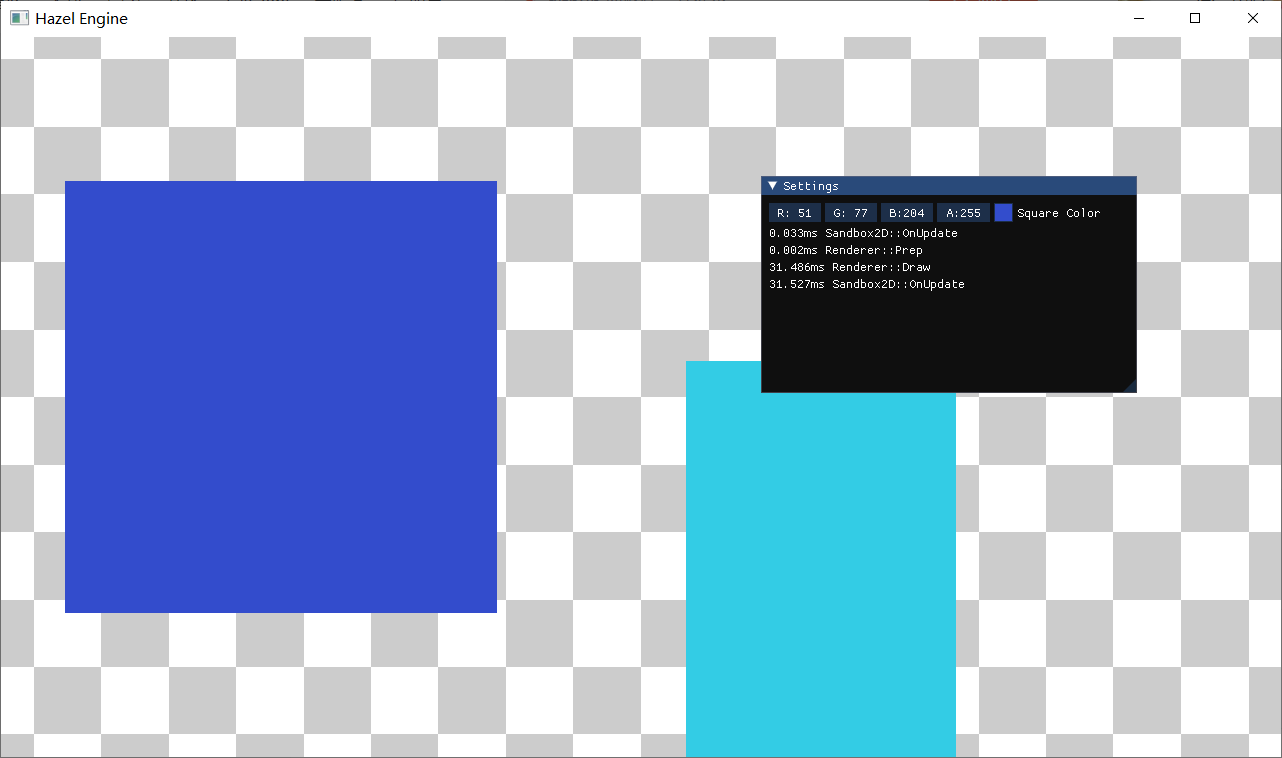
在Imgui窗口上显示对应函数的耗时
056可视化Profiling
前言
-
055的实现
-
055已经实现在程序中看到实时的消耗
-
但是却不是图形可视化那种
-
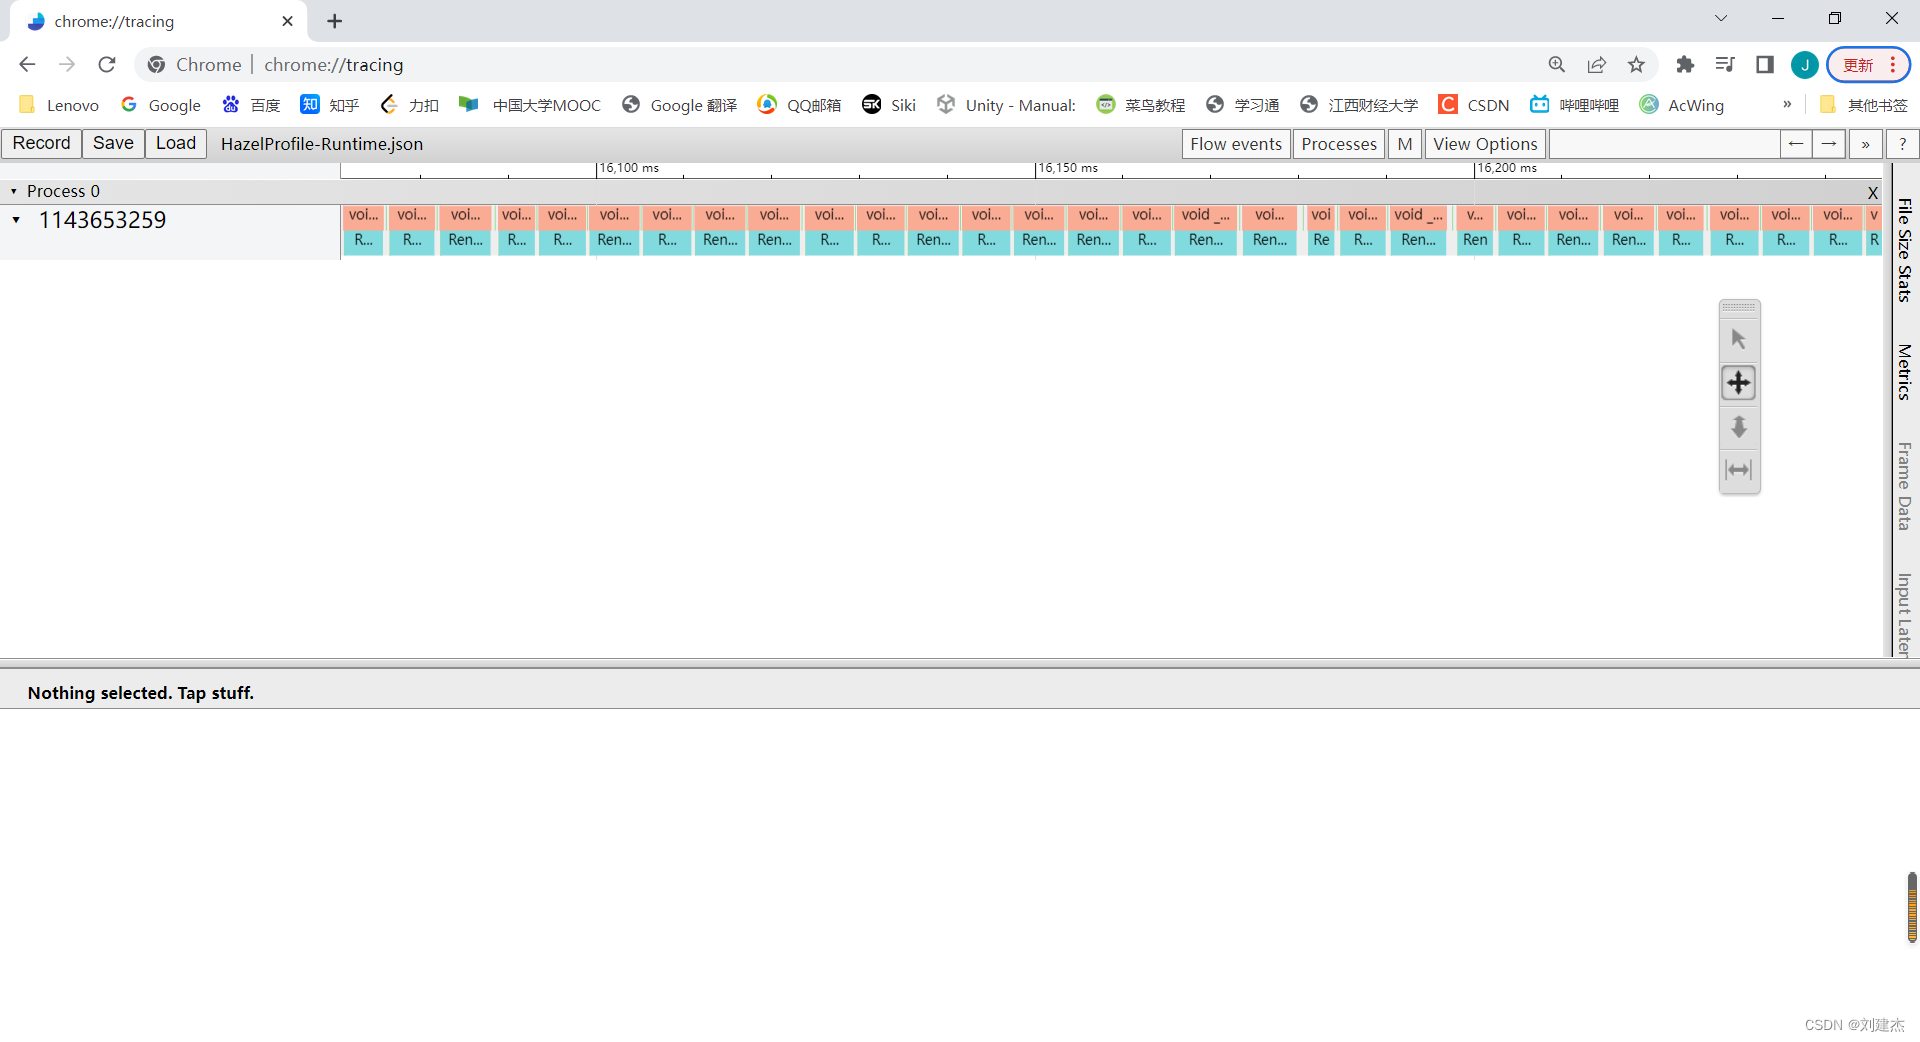
所以需要进一步的封装,并利用谷歌的内置小工具显示实时消耗
chrome://tracing/在浏谷歌览器中输入这个
-
-
实现思路
同055:用作用域、构造函数开始计时、析构函数结束计时,但是输出为chrome浏览器可以解析的json文件。
注意
-
程序关闭时,不能用红色方块停止

-
不然输出的json有问题,会少调用wirtefloot这个函数
-
因为这样函数不是正常的出栈清理,从而解析失败
-
需要正常点击运行窗口的右上角×。
代码
#pragma once

#include <string>
#include <chrono>
#include <algorithm>
#include <fstream>

#include <thread>

namespace Hazel {


	struct ProfileResult
	{


		std::string Name;
		long long Start, End;
		uint32_t ThreadID;
	};

	struct InstrumentationSession
	{


		std::string Name;
	};

	class Instrumentor
	{


	private:
		InstrumentationSession* m_CurrentSession;
		std::ofstream m_OutputStream;
		int m_ProfileCount;
	public:
		Instrumentor()
			: m_CurrentSession(nullptr), m_ProfileCount(0)
		{


		}

		void BeginSession(const std::string& name, const std::string& filepath = "results.json")
		{


			m_OutputStream.open(filepath);
			WriteHeader();
			m_CurrentSession = new InstrumentationSession{

     name };
		}

		void EndSession()
		{


			WriteFooter();
			m_OutputStream.close();
			delete m_CurrentSession;
			m_CurrentSession = nullptr;
			m_ProfileCount = 0;
		}

		void WriteProfile(const ProfileResult& result)
		{


			if (m_ProfileCount++ > 0)
				m_OutputStream << ",";

			std::string name = result.Name;
			std::replace(name.begin(), name.end(), '"', '\'');

			m_OutputStream << "{";
			m_OutputStream << "\"cat\":\"function\",";
			m_OutputStream << "\"dur\":" << (result.End - result.Start) << ',';
			m_OutputStream << "\"name\":\"" << name << "\",";
			m_OutputStream << "\"ph\":\"X\",";
			m_OutputStream << "\"pid\":0,";
			m_OutputStream << "\"tid\":" << result.ThreadID << ",";
			m_OutputStream << "\"ts\":" << result.Start;
			m_OutputStream << "}";

			m_OutputStream.flush();
		}

		void WriteHeader()
		{


			m_OutputStream << "{\"otherData\": {},\"traceEvents\":[";
			m_OutputStream.flush();
		}

		void WriteFooter()
		{


			m_OutputStream << "]}";
			m_OutputStream.flush();
		}

		static Instrumentor& Get()
		{


			static Instrumentor instance;
			return instance;
		}
	};

	class InstrumentationTimer
	{


	public:
		InstrumentationTimer(const char* name)
			: m_Name(name), m_Stopped(false)
		{


			m_StartTimepoint = std::chrono::high_resolution_clock::now();
		}

		~InstrumentationTimer()
		{


			if (!m_Stopped)
				Stop();
		}

		void Stop()
		{


			auto endTimepoint = std::chrono::high_resolution_clock::now();

			long long start = std::chrono::time_point_cast<std::chrono::microseconds>(m_StartTimepoint).time_since_epoch().count();
			long long end = std::chrono::time_point_cast<std::chrono::microseconds>(endTimepoint).time_since_epoch().count();

			uint32_t threadID = std::hash<std::thread::id>{

    }(std::this_thread::get_id());
			Instrumentor::Get().WriteProfile({

     m_Name, start, end, threadID });

			m_Stopped = true;
		}
	private:
		const char* m_Name;
		std::chrono::time_point<std::chrono::high_resolution_clock> m_StartTimepoint;
		bool m_Stopped;
	};
}

#define HZ_PROFILE 1
#if HZ_PROFILE
#define HZ_PROFILE_BEGIN_SESSION(name, filepath) ::Hazel::Instrumentor::Get().BeginSession(name, filepath)
#define HZ_PROFILE_END_SESSION() ::Hazel::Instrumentor::Get().EndSession()
#define HZ_PROFILE_SCOPE(name) ::Hazel::InstrumentationTimer timer##__LINE__(name); // LINE是为了防止重定义变量名
#define HZ_PROFILE_FUNCTION() HZ_PROFILE_SCOPE(__FUNCSIG__)// 函数作用域本身就是scope,只不过是要获取函数名称
#else
#define HZ_PROFILE_BEGIN_SESSION(name, filepath)
#define HZ_PROFILE_END_SESSION()
#define HZ_PROFILE_SCOPE(name)
#define HZ_PROFILE_FUNCTION()
#endif
EntryPoint.h
int main(int argc, char** argv) {


	Hazel::Log::Init();

	HZ_PROFILE_BEGIN_SESSION("Startup", "HazelProfile-Startup.json");
	auto app = Hazel::CreateApplication();
	HZ_PROFILE_END_SESSION();

	HZ_PROFILE_BEGIN_SESSION("Runtime", "HazelProfile-Runtime.json");
	app->Run();
	HZ_PROFILE_END_SESSION();

	HZ_PROFILE_BEGIN_SESSION("Startup", "HazelProfile-Shutdown.json");
	delete app;
	HZ_PROFILE_END_SESSION();
}

Sandbox2D.cpp
void Sandbox2D::OnUpdate(Hazel::Timestep ts)
{


	HZ_PROFILE_FUNCTION();
	{


		HZ_PROFILE_SCOPE("m_CameraController OnUpdate");
		m_CameraController.OnUpdate(ts);
	}

	{


		HZ_PROFILE_SCOPE("Renderer Prep");
		Hazel::RenderCommand::SetClearColor({

     0.1f, 0.1f, 0.1f, 1 });
		Hazel::RenderCommand::Clear();
	}
	{


		HZ_PROFILE_SCOPE("Renderer Draw");
		Hazel::Renderer2D::BeginScene(m_CameraController.GetCamera());
		Hazel::Renderer2D::DrawQuad({

    -1.0f, 0.0f}, {

    0.8f,0.8f}, m_FlatColor);
		Hazel::Renderer2D::DrawQuad({

     0.5f, -0.5f }, {

     0.5f, 0.8f }, {

    0.2f, 0.8f, 0.9f, 1.0f});
		Hazel::Renderer2D::DrawQuad({

     0.0f, 0.0f, -0.1f }, {

     10.0f, 10.0f }, m_SquareTexture);
		Hazel::Renderer2D::EndScene();
	}
}
效果
057在每处关键地方测量时间消耗
前言
-
此节想法
想在引擎中可以有按钮手动开启是否开始测量,手动关闭
以免运行时,导致写入json文件太大,几百兆甚至几G
-
如何实现
在此之前肯定需要在测量代码处添加测量代码,所以在很多处都添加上了测量代码。
但是此节并没有实现按钮开启和关闭。
效果
-
整体分析
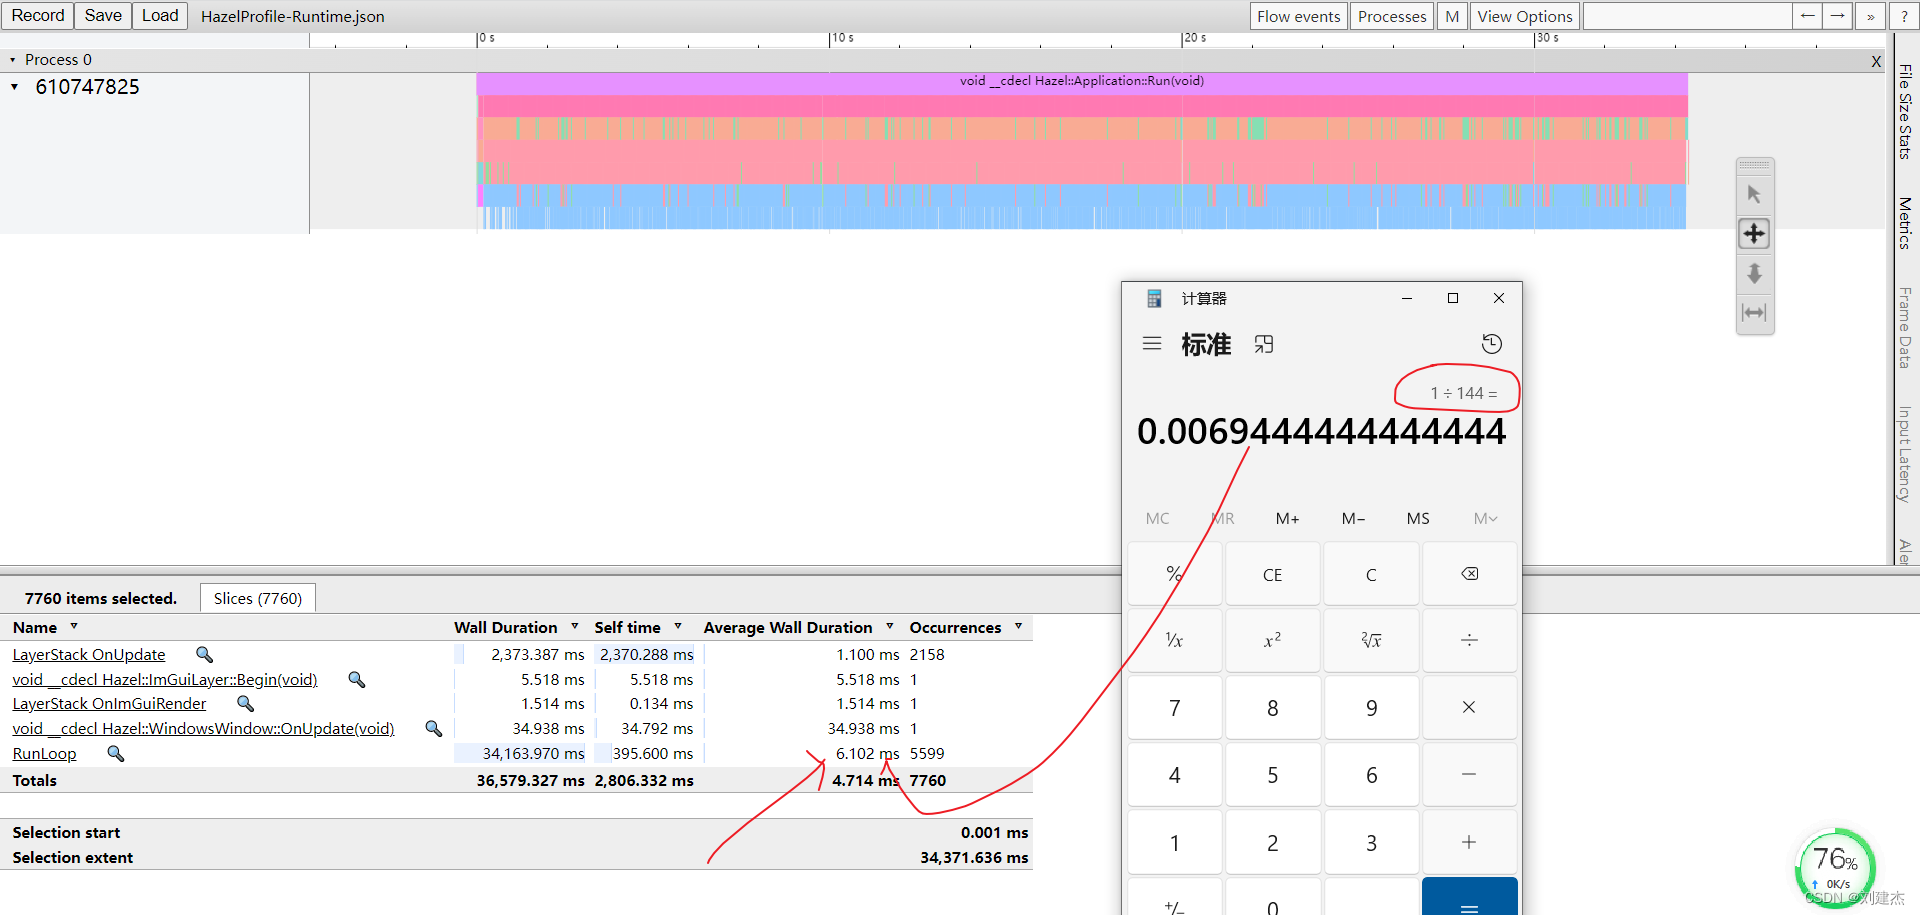
可以用渲染每帧的平均时间得出计算机屏幕的帧率。
1/0.006 ~ 140
-
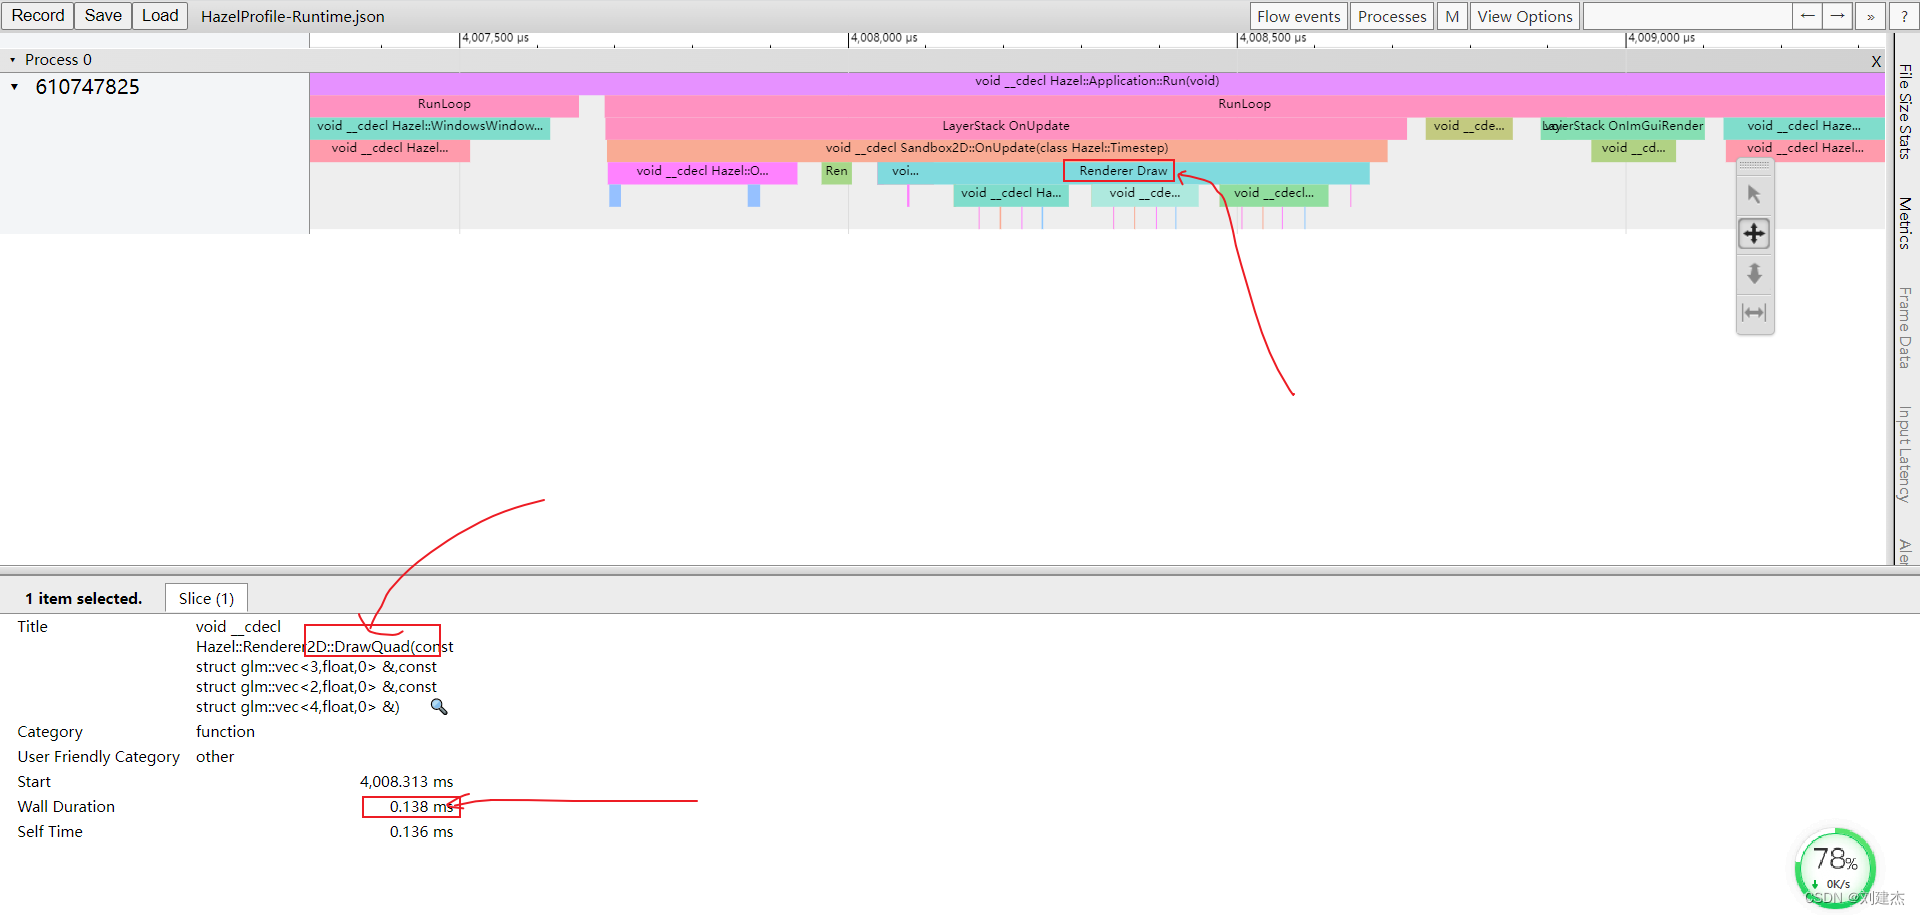
单个分析