0.引言
PCL的pcl_plotter函数,用来对点云数据绘制分析图,例如某一行或列点云Z值的变化图。pcl_plotter提供了一个直接、简单的绘图界面,可以在库中可视化所有类型的重要绘图比如从多项式函数或直方图。本文记录pcl_plotter函数的使用。
1.创建功能按钮
(1)设计.ui文件
①设计按钮
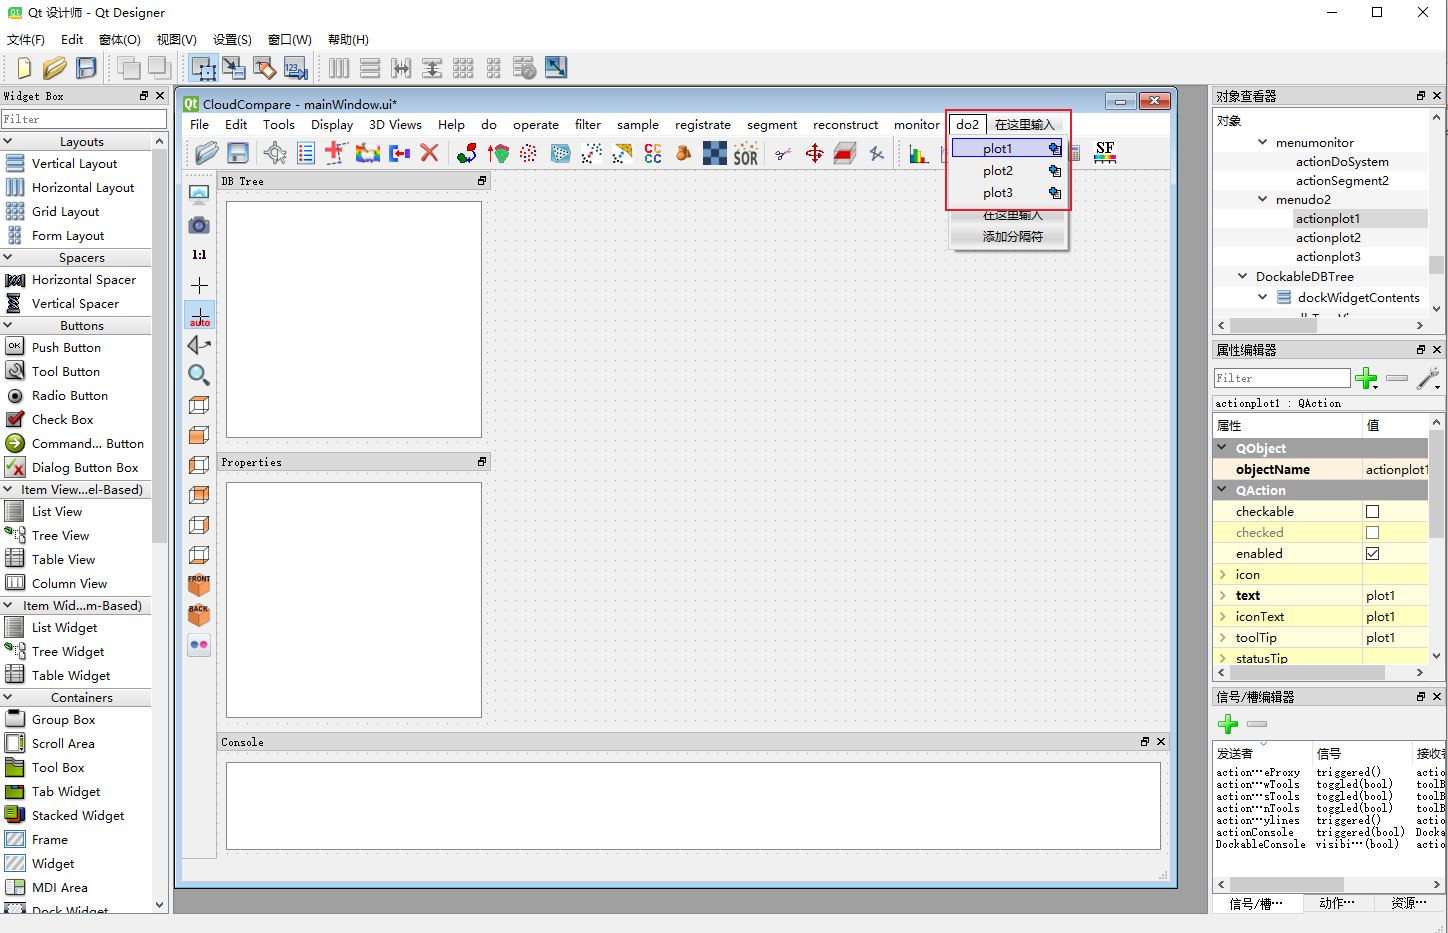
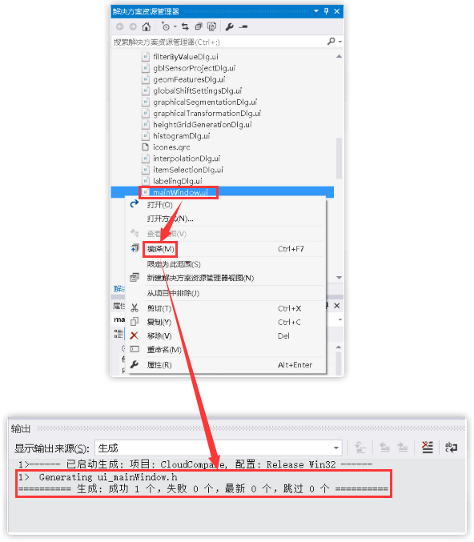
②编译.ui
(2)修改mainwindow.h文件
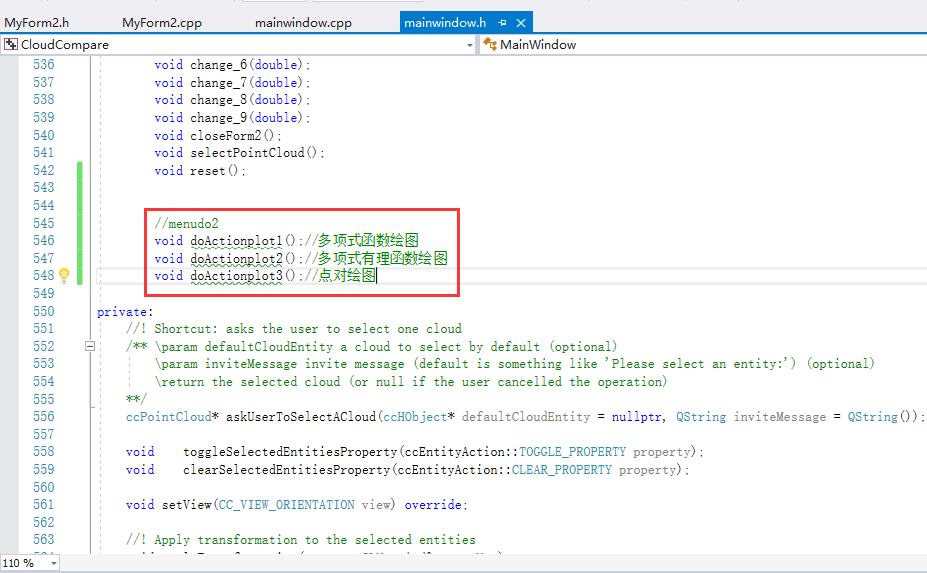
//menudo2
void doActionplot1();//多项式函数绘图
void doActionplot2();//多项式有理函数绘图
void doActionplot3();//点对绘图
(3)修改mainwindow.cpp文件
①添加头文件
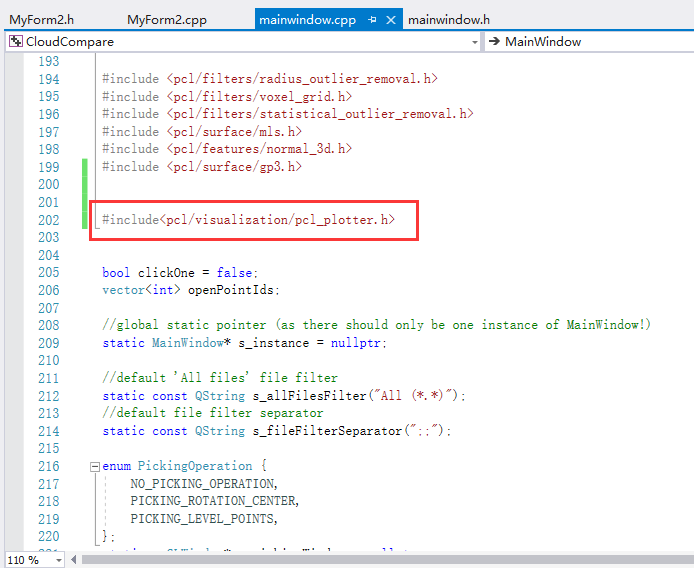
#include<pcl/visualization/pcl_plotter.h>
②添加实现代码
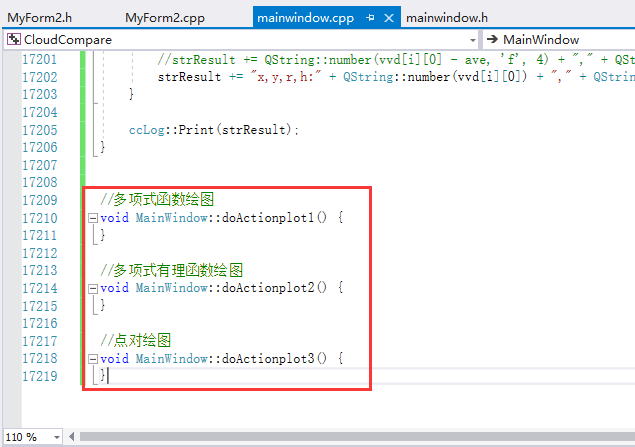
//多项式函数绘图
void MainWindow::doActionplot1() {


}

//多项式有理函数绘图
void MainWindow::doActionplot2() {


}

//点对绘图
void MainWindow::doActionplot3() {


}
③添加信号槽函数
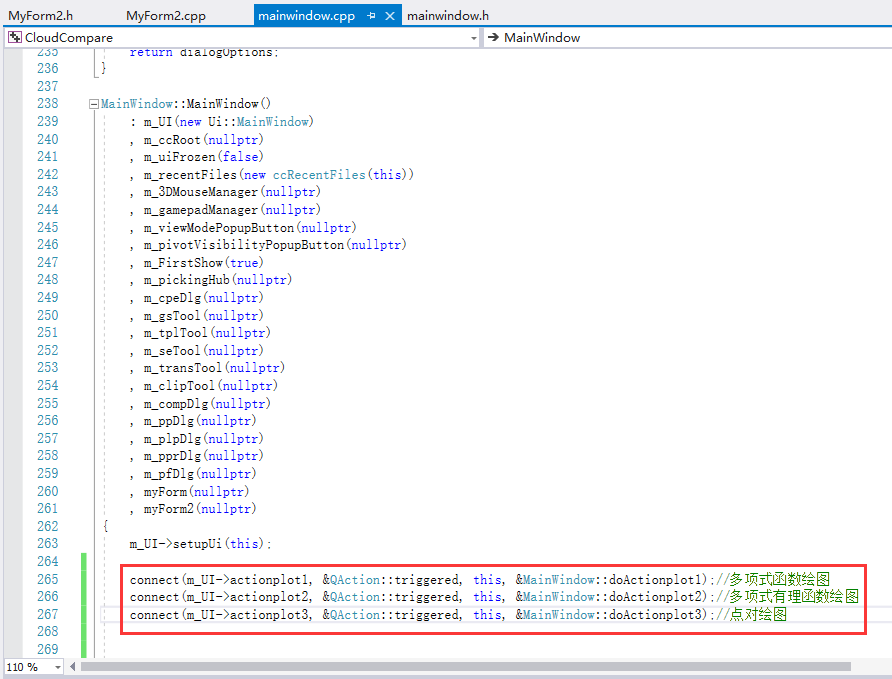
connect(m_UI->actionplot1, &QAction::triggered, this, &MainWindow::doActionplot1);//多项式函数绘图
connect(m_UI->actionplot2, &QAction::triggered, this, &MainWindow::doActionplot2);//多项式有理函数绘图
connect(m_UI->actionplot3, &QAction::triggered, this, &MainWindow::doActionplot3);//点对绘图
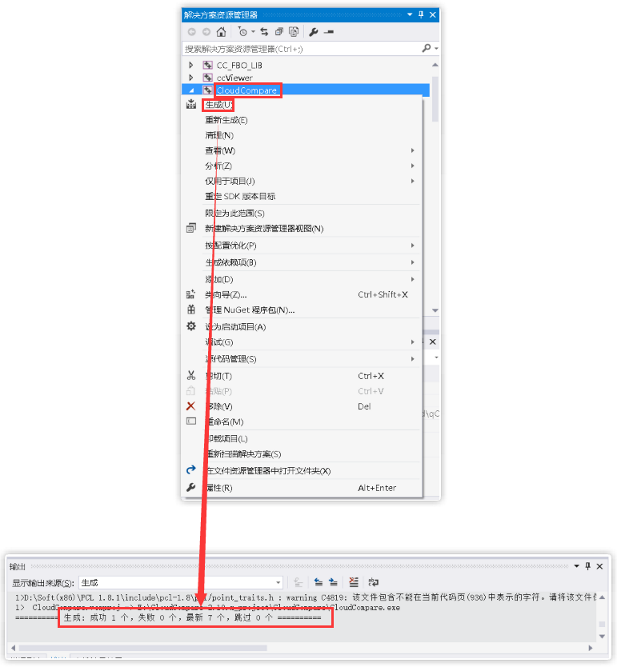
(4)生成
2.多项式函数绘图
(1)代码绘图
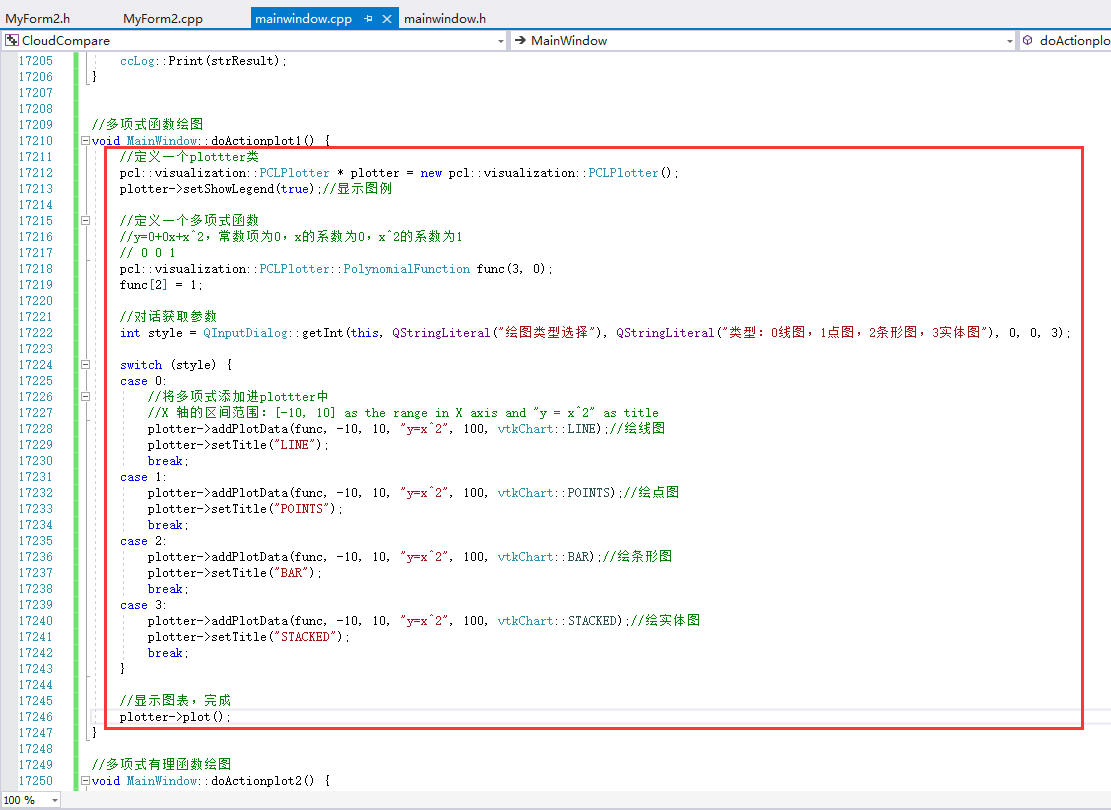
//多项式函数绘图
void MainWindow::doActionplot1() {
//定义一个plottter类
pcl::visualization::PCLPlotter * plotter = new pcl::visualization::PCLPlotter();
plotter->setShowLegend(true);//显示图例
//定义一个多项式函数
//y=0+0x+x^2,常数项为0,x的系数为0,x^2的系数为1
// 0 0 1
pcl::visualization::PCLPlotter::PolynomialFunction func(3, 0);
func[2] = 1;
//对话获取参数
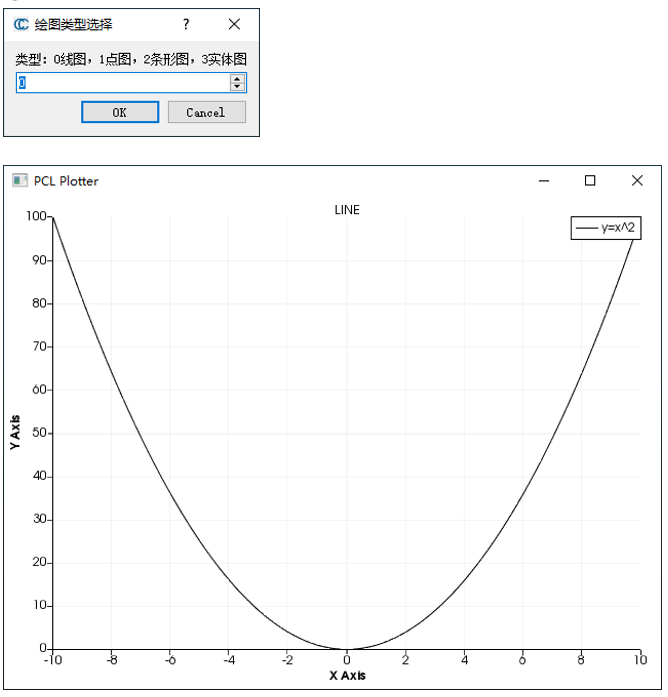
int style = QInputDialog::getInt(this, QStringLiteral("绘图类型选择"), QStringLiteral("类型:0线图,1点图,2条形图,3实体图"), 0, 0, 3);
switch (style) {
case 0:
//将多项式添加进plottter中
//X 轴的区间范围:[-10, 10] as the range in X axis and "y = x^2" as title
plotter->addPlotData(func, -10, 10, "y=x^2", 100, vtkChart::LINE);//绘线图
plotter->setTitle("LINE");
break;
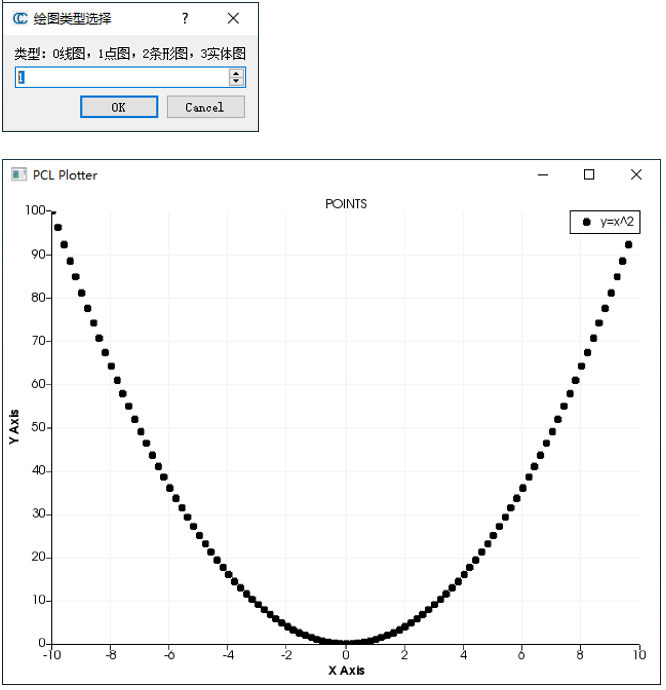
case 1:
plotter->addPlotData(func, -10, 10, "y=x^2", 100, vtkChart::POINTS);//绘点图
plotter->setTitle("POINTS");
break;
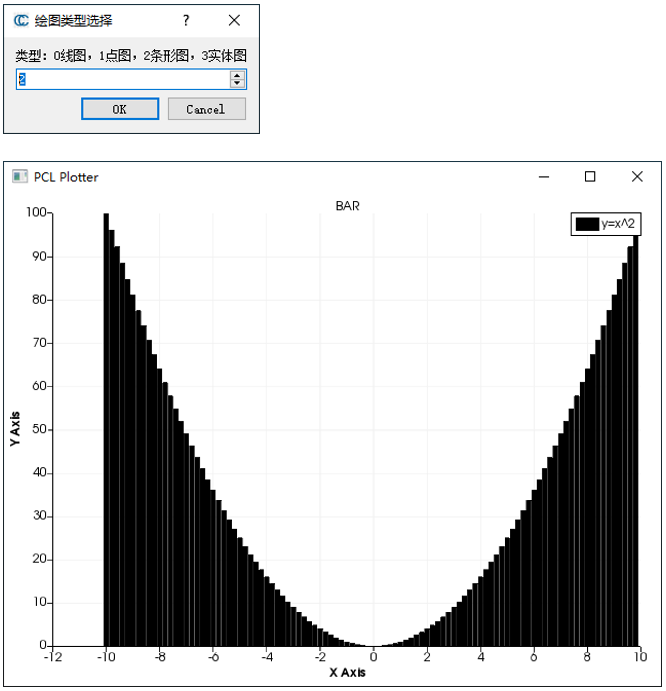
case 2:
plotter->addPlotData(func, -10, 10, "y=x^2", 100, vtkChart::BAR);//绘条形图
plotter->setTitle("BAR");
break;
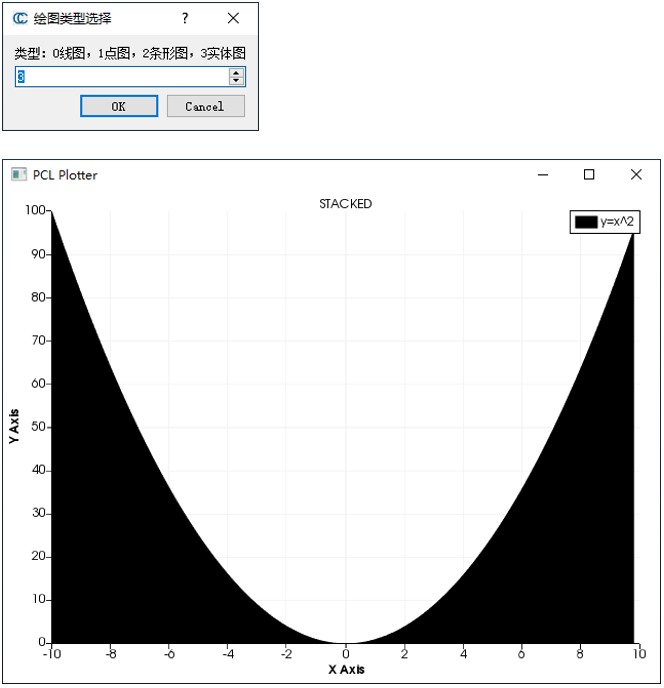
case 3:
plotter->addPlotData(func, -10, 10, "y=x^2", 100, vtkChart::STACKED);//绘实体图
plotter->setTitle("STACKED");
break;
}
//显示图表,完成
plotter->plot();
}
(2)绘图结果
①线图
②点图
③条形图
④实体图
3.多项式有理函数绘图
(1)代码绘图
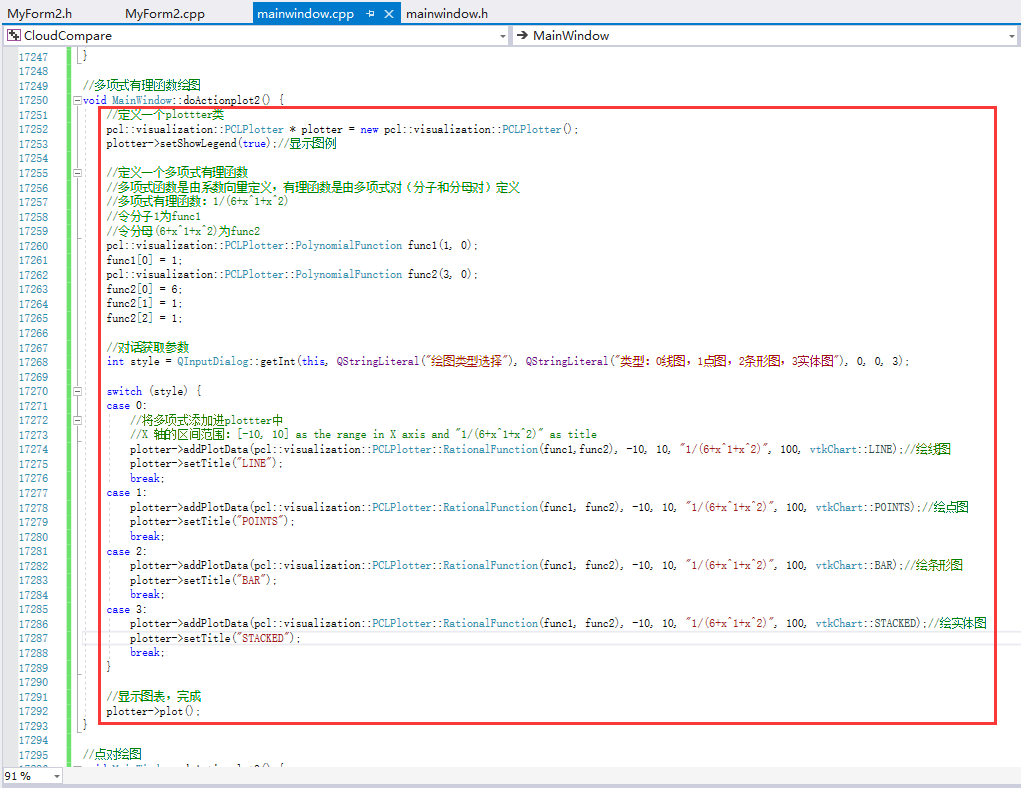
//多项式有理函数绘图
void MainWindow::doActionplot2() {
//定义一个plottter类
pcl::visualization::PCLPlotter * plotter = new pcl::visualization::PCLPlotter();
plotter->setShowLegend(true);//显示图例
//定义一个多项式有理函数
//多项式函数是由系数向量定义,有理函数是由多项式对(分子和分母对)定义
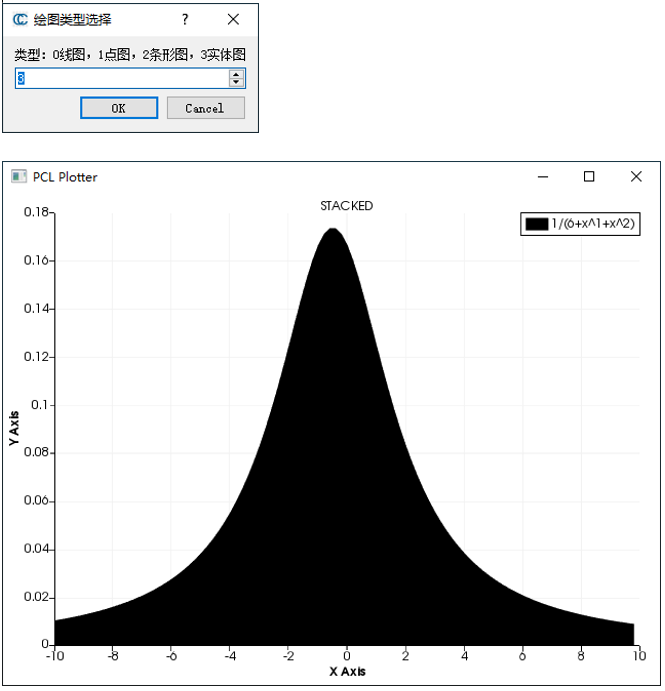
//多项式有理函数:1/(6+x^1+x^2)
//令分子1为func1
//令分母(6+x^1+x^2)为func2
pcl::visualization::PCLPlotter::PolynomialFunction func1(1, 0);
func1[0] = 1;
pcl::visualization::PCLPlotter::PolynomialFunction func2(3, 0);
func2[0] = 6;
func2[1] = 1;
func2[2] = 1;
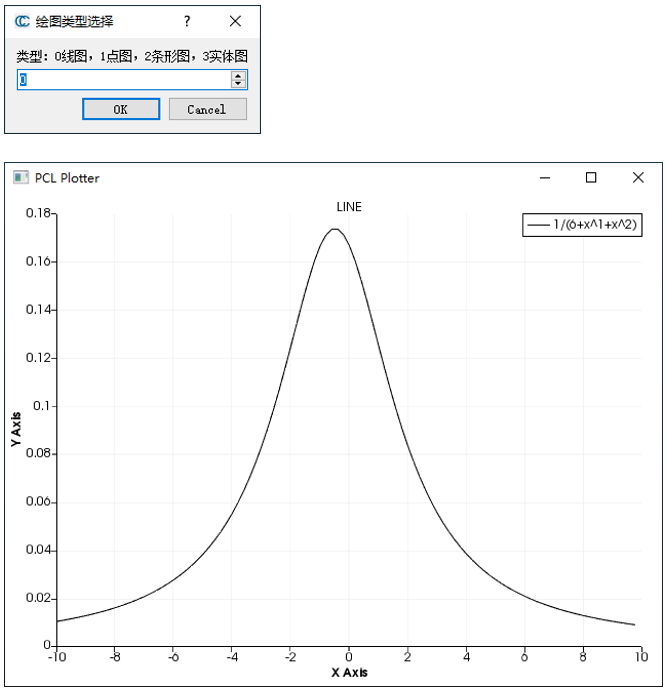
//对话获取参数
int style = QInputDialog::getInt(this, QStringLiteral("绘图类型选择"), QStringLiteral("类型:0线图,1点图,2条形图,3实体图"), 0, 0, 3);
switch (style) {
case 0:
//将多项式添加进plottter中
//X 轴的区间范围:[-10, 10] as the range in X axis and "1/(6+x^1+x^2)" as title
plotter->addPlotData(pcl::visualization::PCLPlotter::RationalFunction(func1,func2), -10, 10, "1/(6+x^1+x^2)", 100, vtkChart::LINE);//绘线图
plotter->setTitle("LINE");
break;
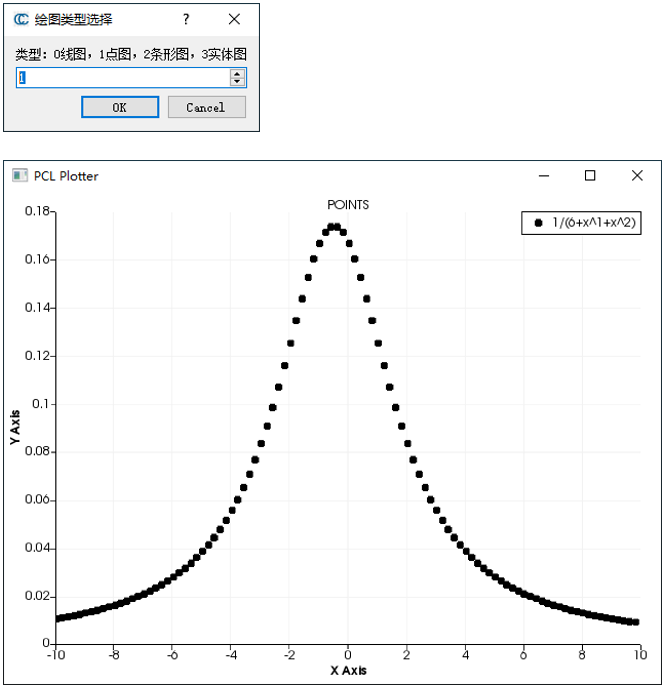
case 1:
plotter->addPlotData(pcl::visualization::PCLPlotter::RationalFunction(func1, func2), -10, 10, "1/(6+x^1+x^2)", 100, vtkChart::POINTS);//绘点图
plotter->setTitle("POINTS");
break;
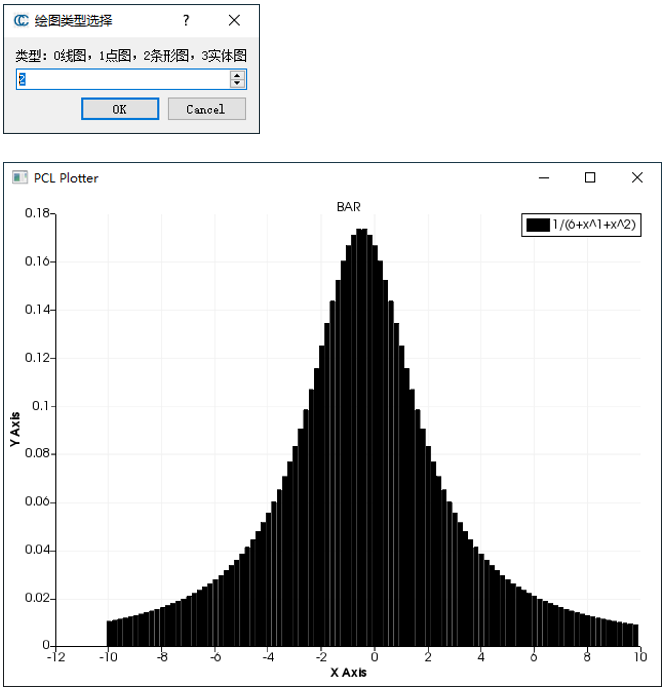
case 2:
plotter->addPlotData(pcl::visualization::PCLPlotter::RationalFunction(func1, func2), -10, 10, "1/(6+x^1+x^2)", 100, vtkChart::BAR);//绘条形图
plotter->setTitle("BAR");
break;
case 3:
plotter->addPlotData(pcl::visualization::PCLPlotter::RationalFunction(func1, func2), -10, 10, "1/(6+x^1+x^2)", 100, vtkChart::STACKED);//绘实体图
plotter->setTitle("STACKED");
break;
}
//显示图表,完成
plotter->plot();
}
(2)绘图结果
①线图
②点图
③条形图
④实体图
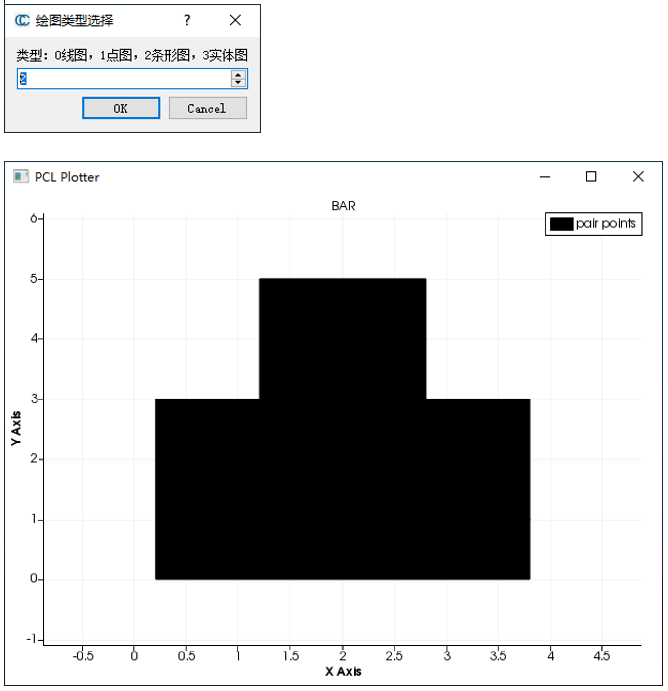
4.点对绘图
(1)代码绘图
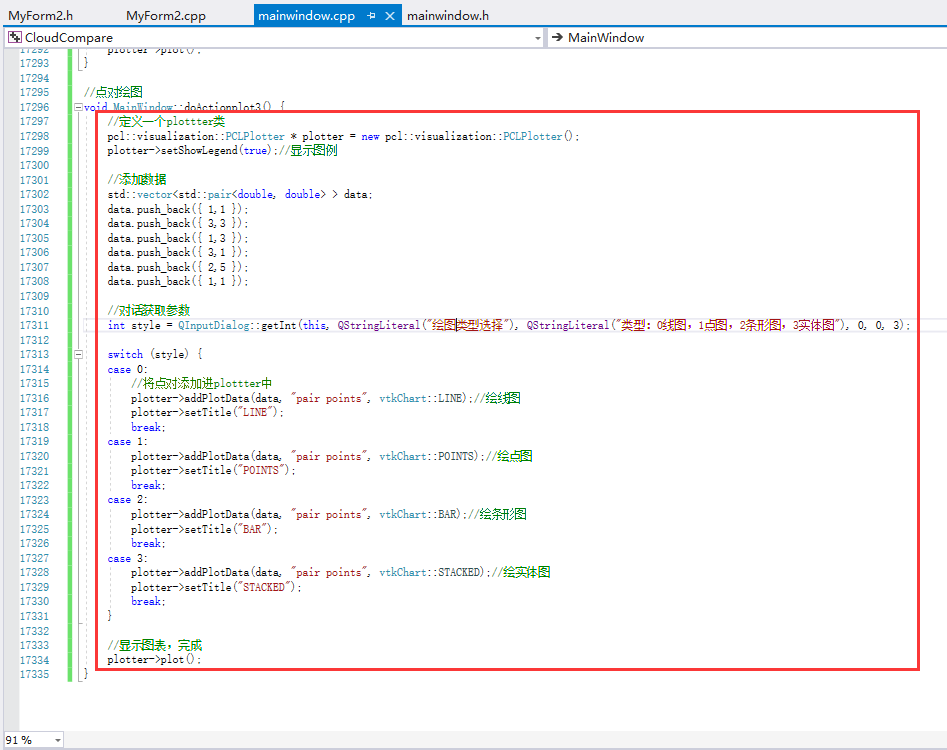
//点对绘图
void MainWindow::doActionplot3() {
//定义一个plottter类
pcl::visualization::PCLPlotter * plotter = new pcl::visualization::PCLPlotter();
plotter->setShowLegend(true);//显示图例
//添加数据
std::vector<std::pair<double, double> > data;
data.push_back({
1,1 });
data.push_back({
3,3 });
data.push_back({
1,3 });
data.push_back({
3,1 });
data.push_back({
2,5 });
data.push_back({
1,1 });
//对话获取参数
int style = QInputDialog::getInt(this, QStringLiteral("绘图类型选择"), QStringLiteral("类型:0线图,1点图,2条形图,3实体图"), 0, 0, 3);
switch (style) {
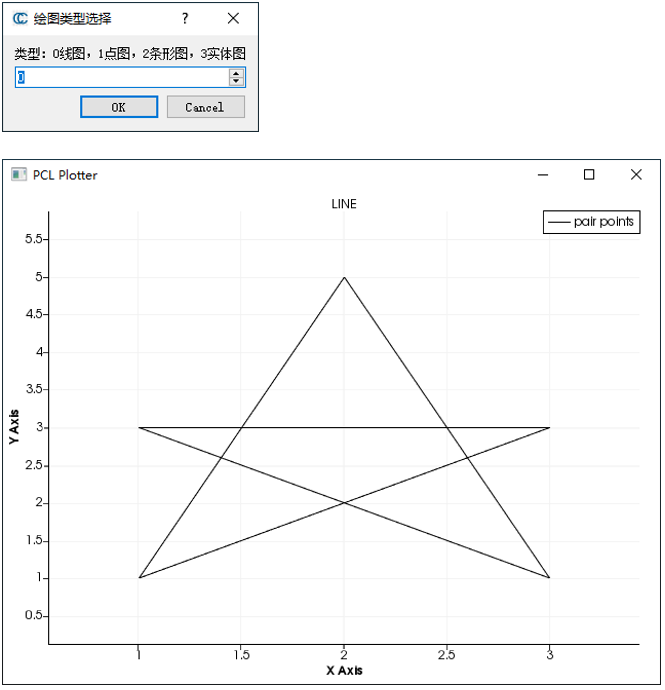
case 0:
//将点对添加进plottter中
plotter->addPlotData(data, "pair points", vtkChart::LINE);//绘线图
plotter->setTitle("LINE");
break;
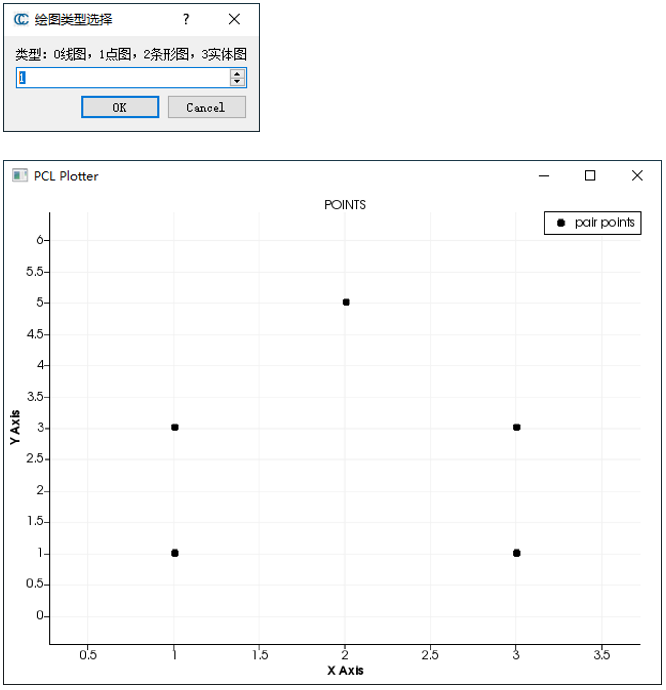
case 1:
plotter->addPlotData(data, "pair points", vtkChart::POINTS);//绘点图
plotter->setTitle("POINTS");
break;
case 2:
plotter->addPlotData(data, "pair points", vtkChart::BAR);//绘条形图
plotter->setTitle("BAR");
break;
case 3:
plotter->addPlotData(data, "pair points", vtkChart::STACKED);//绘实体图
plotter->setTitle("STACKED");
break;
}
//显示图表,完成
plotter->plot();
}
(2)绘图结果
①线图
②点图
③条形图
④实体图

参考资料:
[1] SOC罗三炮. PCL教程-PCLPlotter图表可视化类; 2022-04-11 [accessed 2023-07-13].
[2] 斯坦福的兔子. 【PCL自学:PCLPlotter】PCLPlotter绘制数据分析图; 2022-06-25 [accessed 2023-07-13].
[3] jiaojialulu. (十四)Visualization教程二; 2017-04-05 [accessed 2023-07-13].
[4] 起个名字费劲死了. PCL:PCL_PCLPlotter类,绘制折线图; 2019-08-20 [accessed 2023-07-13].
[5] zhy29563. 【PCL】PCLPlotter 绘制二维图; 2022-01-14 [accessed 2023-07-13].
[6] 杰尼君. 点云库PCL学习笔记 – 可视化 – 4.PCLPlotter可视化特征直方图; 2022-03-04 [accessed 2023-07-13].
[7] Rson555. PCL_PCLPlotter类学习教程; 2019-01-28 [accessed 2023-07-13].