cesium添加点、线、面有两种方式,一种是Entity方式,另一种是Primitive。
相对于Entity,使用Primitive具有以下优势:
(1)性能:绘制大量Primitive时,可以将其合并为单个Geometry以减轻CPU负担、更好的使用GPU。合并Primitive由web worker线程执行,以保持UI响应性;
(2)灵活性:Geometry与Appearance 解耦,两者可以分别进行修改;
(3)低级别访问:易于编写GLSL顶点、片段着色器、使用自定义的渲染状态 。
同时,也具有以下劣势:
(1)需要编写更多的代码,并且对图形编程有更深刻的理解,尤其是OpenGL知识;
(2)需要对组合几何形状对于静态数据有效,而对于动态数据则不一定有效。
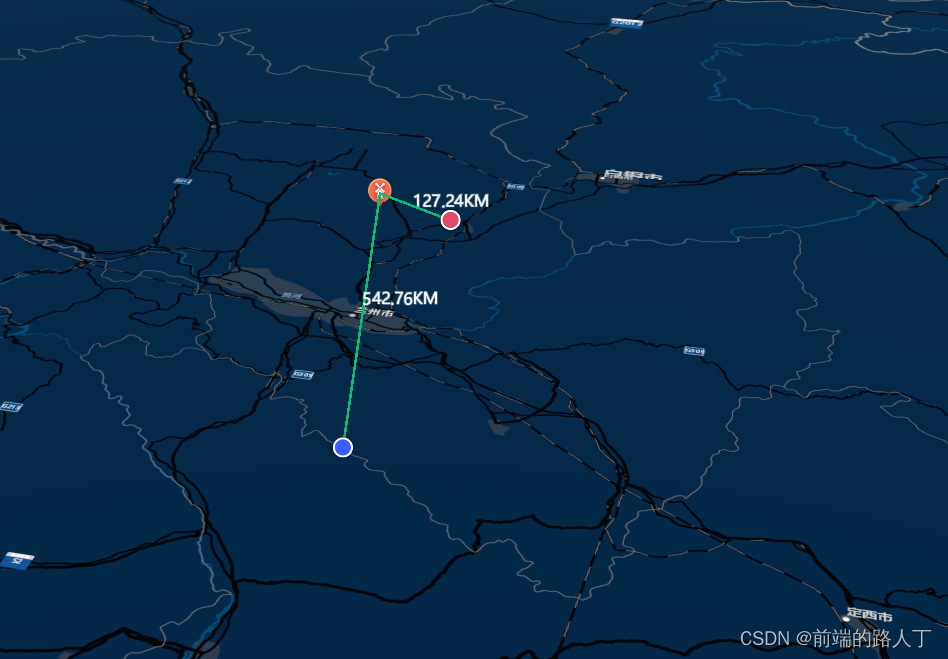
需求:添加点、线。点击地图会消失,点击点会出现
效果:
代码如下:这里this.map是我实例化传入进来的,你可以使用viewer代替。
   this.polyline_sate = []
      this.polyline_sate.push(pick.id.lon)
      this.polyline_sate.push(pick.id.lat)
      this.polyline_sate.push(20000)
      this.polyline_sate.push(pick.id.truthLon)
      this.polyline_sate.push(pick.id.truthLat)
      this.polyline_sate.push(20000)
      this.polyline_sate.push(pick.id.lon)
      this.polyline_sate.push(pick.id.lat)
      this.polyline_sate.push(20000)
      this.polyline_sate.push(pick.id.secondLon)
      this.polyline_sate.push(pick.id.secondLat)
      this.polyline_sate.push(20000)
      this.drawline(pick.id)
// 使用primitive 画线
  drawline(val) {
    if (this.polyline_sate.length >= 2) {
      this.lineDataSource.add({
        // Cesium.Cartesian3.fromDegreesArrayHeights([经度1, 纬度1, 高度1, 经度2, 纬度2, 高度2])
        // 如果有高度,上面的 this.polyline_sate 里面要增加高度的
        positions: new Cesium.Cartesian3.fromDegreesArrayHeights(this.polyline_sate),
        // 宽度
        width: 2,
        material: Cesium.Material.fromType('Color', {
          color: Cesium.Color.fromCssColorString('#0ABD73FF'),
        }),
        distanceDisplayCondition: new Cesium.DistanceDisplayCondition(0, 800000),
        clampToGround: false,
        // 线的颜色
      })

      this.drawLabel(val)
      this.addsate(val)
    } else {
      this.lineDataSource.removeAll()
      this.labels.removeAll()
      this.satebillboards.removeAll()
    }
  }
  // 使用entities画线
  newdrawline() {
    if (this.polyline_sate.length >= 2) {
      this.lineDataSource.entities.add({
        name: 'line',
        polyline: {
            positions: new Cesium.Cartesian3.fromDegreesArrayHeights(this.polyline_sate),
            width: 2,
            material: Cesium.Color.fromCssColorString('#0ABD73FF'),
          clampToGround: false,
        },
      })
      this.drawLabel()
    } else {
      this.lineDataSource.entities.removeAll()
    }
  }
  // 标注
  drawLabel(val) {
   this.labels.add({
      position: Cesium.Cartesian3.fromDegreesArrayHeights([(val.lon + val.truthLon) / 2,(val.lat + val.truthLat) / 2,20000])[0],
      text: (Number(val.distanceMinGrad)*1000).toFixed(2)+'KM',
      font: '16px sans-serif',
      distanceDisplayCondition: new Cesium.DistanceDisplayCondition(0, 800000),
   });
   this.labels.add({
    position: Cesium.Cartesian3.fromDegreesArrayHeights([(val.lon + val.secondLon) / 2,(val.lat + val.secondLat) / 2,20000])[0],
    text: (Number(val.distanceMinGt)*1000).toFixed(2)+'KM',
    font: '16px sans-serif',
    distanceDisplayCondition: new Cesium.DistanceDisplayCondition(0, 800000),
  });
  }
  // 添加点
  addsate(item) {
    const truh=_.cloneDeep(item)
    truh.shownewtooltip='truh'
    this.satebillboards.add({
      position: Cesium.Cartesian3.fromDegrees(item.truthLon, item.truthLat, 20000),
      image: 'img/sate/red.png',
      //   color: Cesium.Color.fromCssColorString(),
      // rotation: deg2rad(item.angle),
      scale: 0.5,
      id: truh,
      // height: 10,
      heightReference: Cesium.HeightReference.RELATIVE_TO_GROUND,
      distanceDisplayCondition: new Cesium.DistanceDisplayCondition(0, 1000000),
      //用来展示哪种弹窗
    })
    const second=_.cloneDeep(item)
    second.shownewtooltip='second'
    this.satebillboards.add({
      position: Cesium.Cartesian3.fromDegrees(item.secondLon, item.secondLat, 20000),
      image: 'img/sate/blue.png',
      //   color: Cesium.Color.fromCssColorString(),
      // rotation: deg2rad(item.angle),
      scale: 0.5,
      id: second,
      // height: 10,
      heightReference: Cesium.HeightReference.RELATIVE_TO_GROUND,
      distanceDisplayCondition: new Cesium.DistanceDisplayCondition(0, 1000000),
      //用来展示哪种弹窗
    })
  }