一、Spring Boot Actuator是什么?
提供监控功能,可以监控很多端点。可以使用http://{ip}:{port}/{endpoint}的形式访问这些监控端点,从而了解应用程序的运行情况。下图为Spring Boot Actuator常用端点及描述:

二、整合步骤
以项目user微服务为例
添加依赖
如下:
<dependency>
   <groupId>org.springframework.boot</groupId>
    <artifactId>spring-boot-starter-actuator</artifactId>
</dependency>
整合Actuator只需要引入依赖即可,同理,也可以为movie微服务整合Actuator
三、测试
/health端点
访问http://localhost:8060/health
报错404,后查看启动日志发现打印出
Exposing 1 endpoint(s) beneath base path ‘/actuator’,访问需要加endpoints的默认url前缀
故访问地址为http://localhost:8060/actuator/health,若仍然报404,则需要检查项目是否配置了context-path
测试结果如图所示:
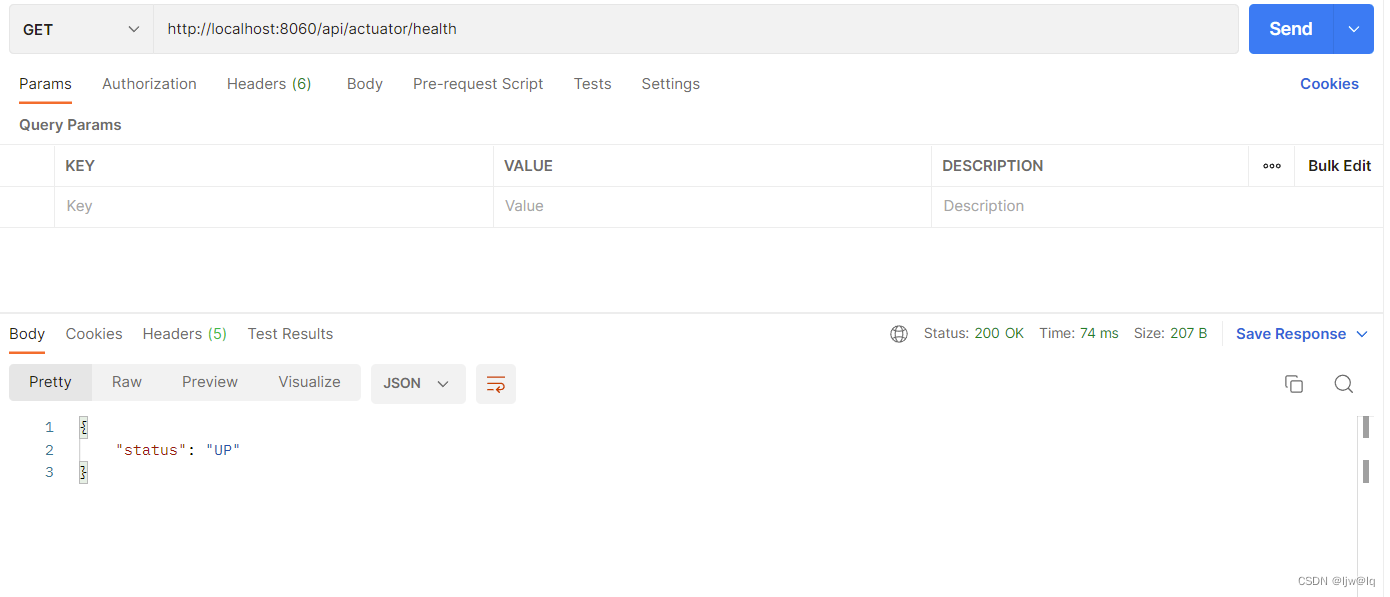
说明:UP代表运行正常,除UP外,还有DOWN、OUT_OF_SERVICE、UNKNOWN等状态。上图只显示了一个概要
情况,如需展示详情,需要设置management.endpoint.health.show-details=always(默认never,
还有when-authorized)或者show-components,如果show-components 没有指定 则用show-details的
值进行展示,否则以show-components的配置为准
下图为添加了management.endpoint.health.show-details=always的测试结果:
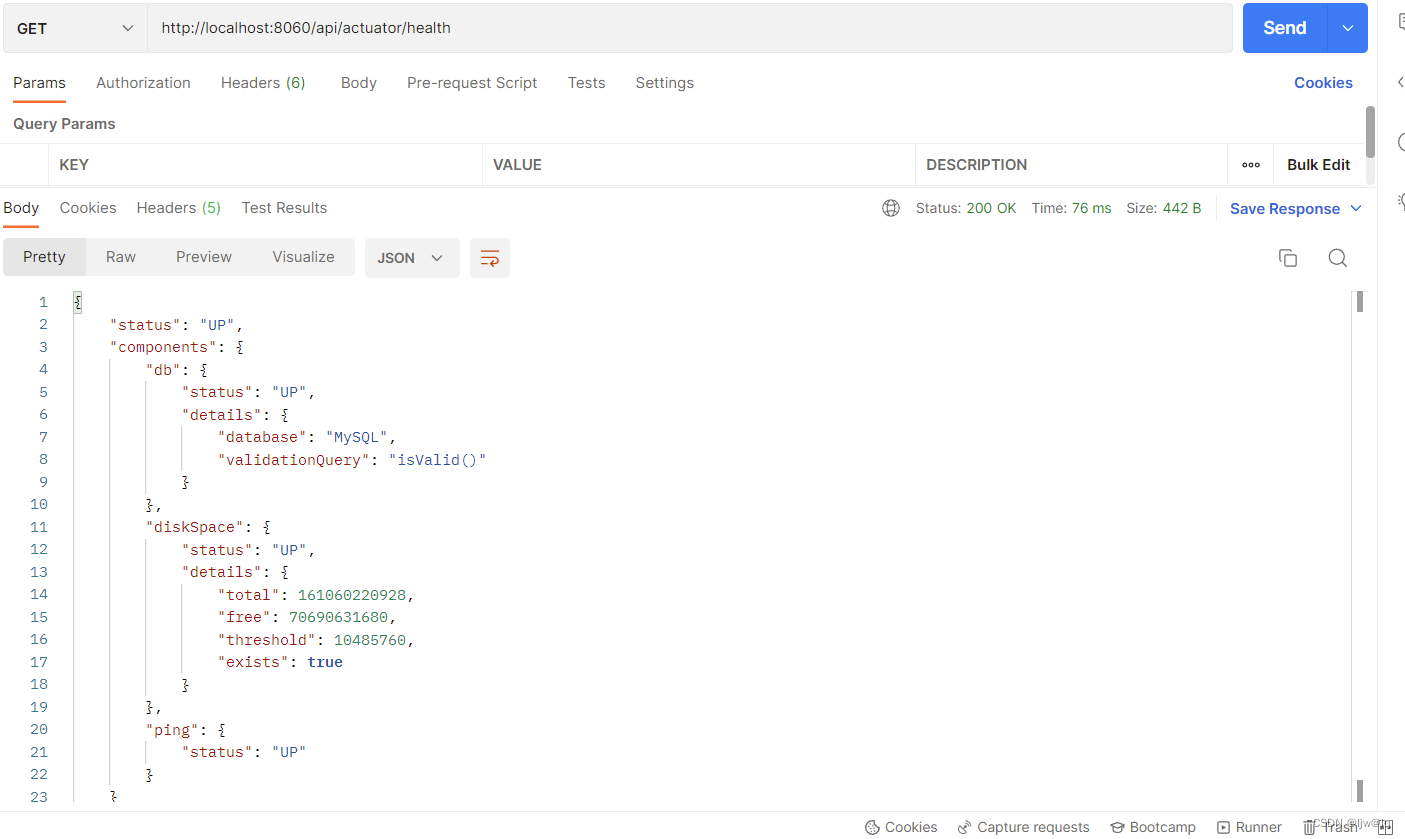
总结:/health的本质,通过检查spring boot 应用程序的资源来判断应用是否正常。
/info端点
访问http://localhost:8060/actuator/info报404
检查暴露端点,访问http://localhost:8060/actuator,发现暴露端点如下图示:

说明:端点未暴露时,可以通过修改配置management.endpoints.web.exposure.include的值来调整要
暴露的端点,"*"为全部暴露
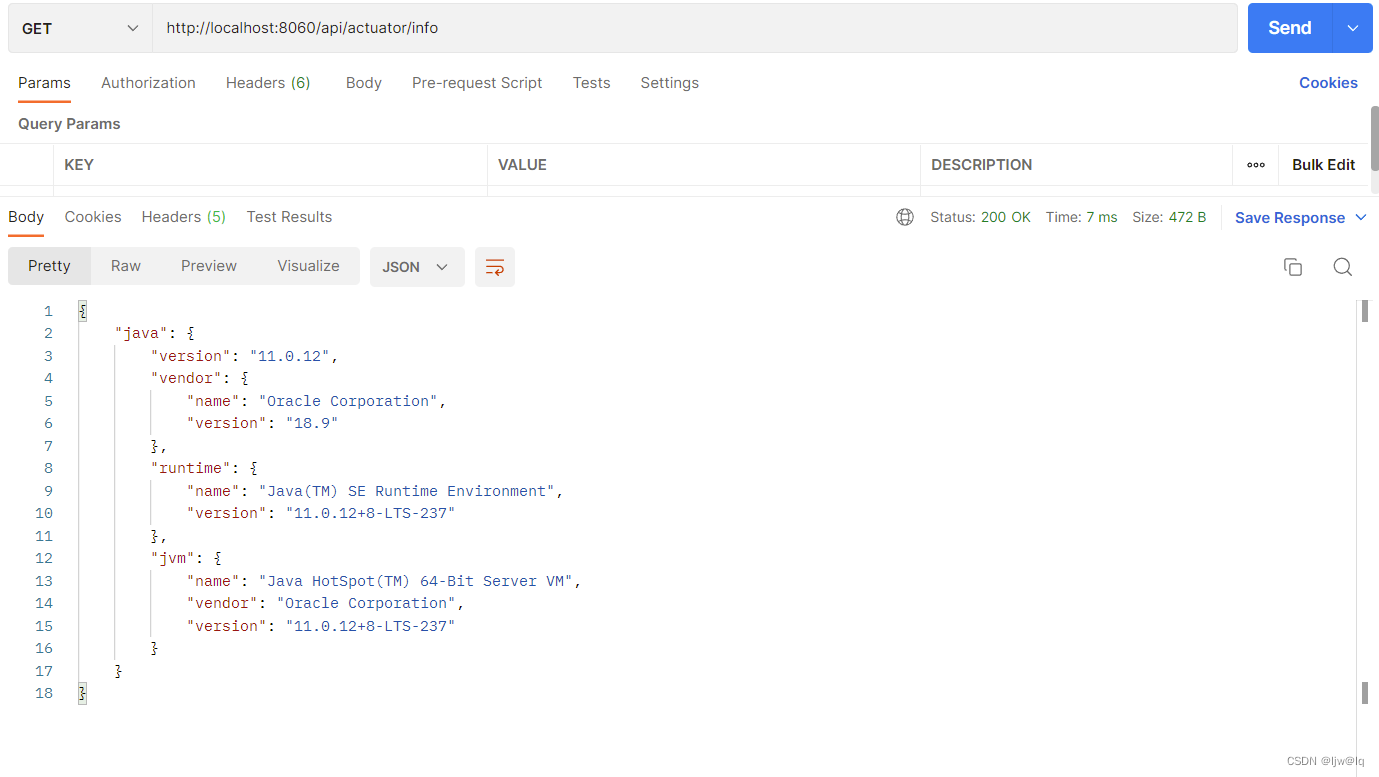
修改配置后访问http://localhost:8060/actuator/info,返回为{},此时info端点没有返回任何数据,修改management.info.java.enabled=true(显示Java 运行时信息)后访问如下图示:
由于Actuator端点较多,本文在此不做赘述,感兴趣的小伙伴可以查阅官方文档进一步学习:
https://docs.spring.io/spring-boot/docs/2.7.1/reference/htmlsingle/