现象
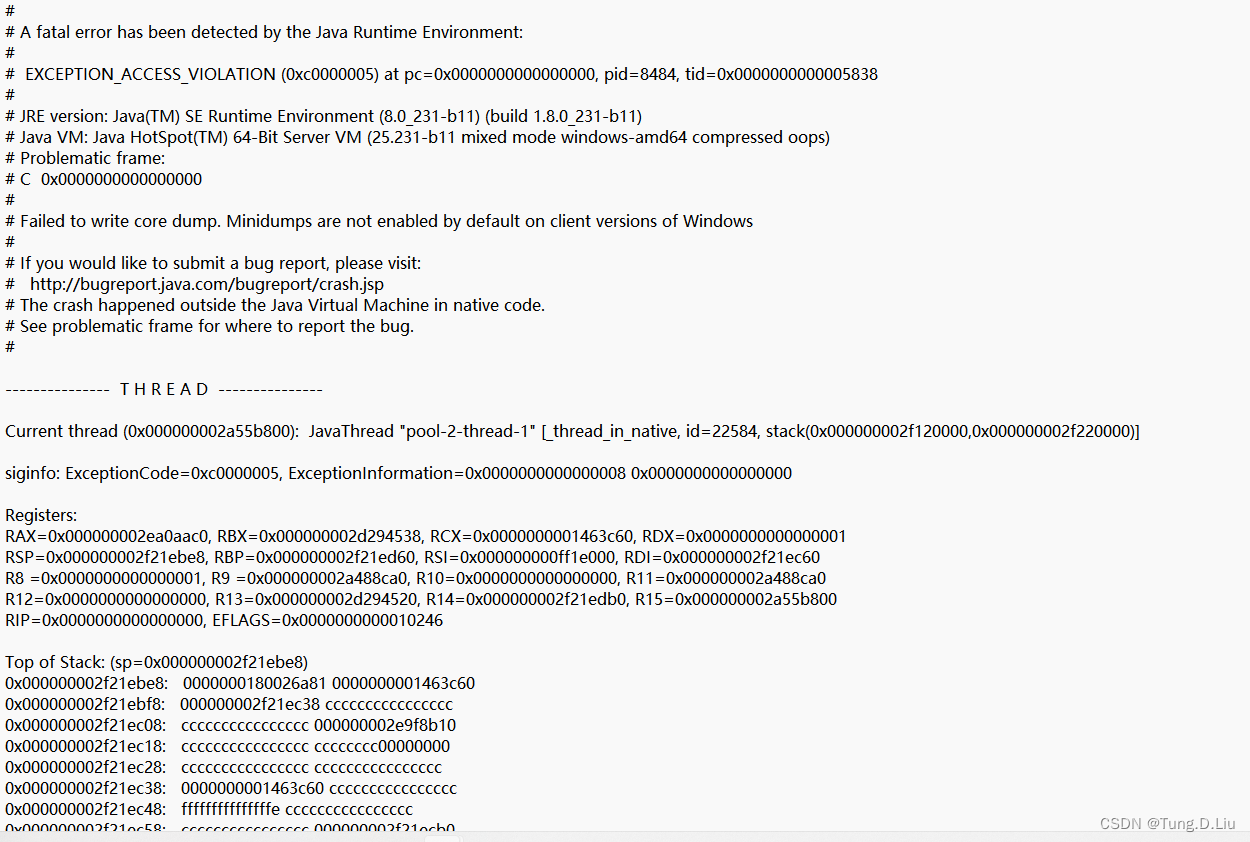
#
# A fatal error has been detected by the Java Runtime Environment:
#
# EXCEPTION_ACCESS_VIOLATION (0xc0000005) at pc=0x0000000000000000, pid=8484, tid=0x0000000000005838
#
# JRE version: Java(TM) SE Runtime Environment (8.0_231-b11) (build 1.8.0_231-b11)
# Java VM: Java HotSpot(TM) 64-Bit Server VM (25.231-b11 mixed mode windows-amd64 compressed oops)
# Problematic frame:
# C 0x0000000000000000
#
# Failed to write core dump. Minidumps are not enabled by default on client versions of Windows
#
# If you would like to submit a bug report, please visit:
# http://bugreport.java.com/bugreport/crash.jsp
# The crash happened outside the Java Virtual Machine in native code.
# See problematic frame for where to report the bug.
#
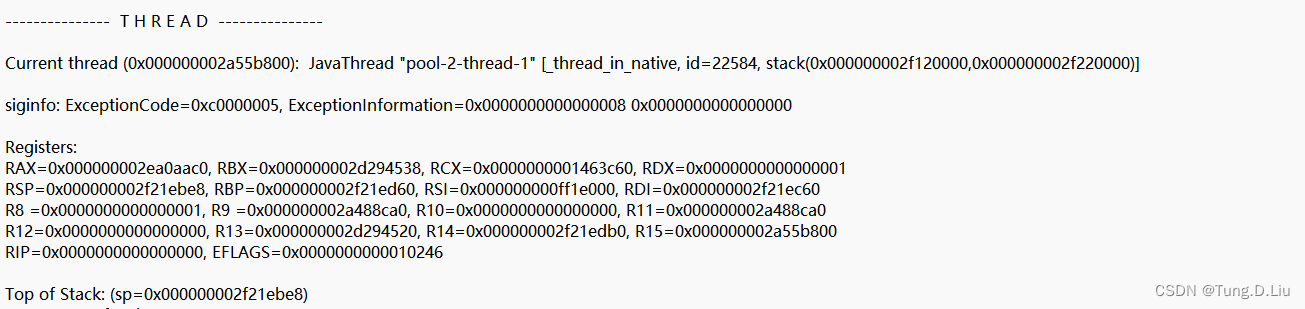
--------------- T H R E A D ---------------
Current thread (0x000000002a55b800): JavaThread "pool-2-thread-1" [_thread_in_native, id=22584, stack(0x000000002f120000,0x000000002f220000)]
siginfo: ExceptionCode=0xc0000005, ExceptionInformation=0x0000000000000008 0x0000000000000000
Registers:
RAX=0x000000002ea0aac0, RBX=0x000000002d294538, RCX=0x0000000001463c60, RDX=0x0000000000000001
RSP=0x000000002f21ebe8, RBP=0x000000002f21ed60, RSI=0x000000000ff1e000, RDI=0x000000002f21ec60
R8 =0x0000000000000001, R9 =0x000000002a488ca0, R10=0x0000000000000000, R11=0x000000002a488ca0
R12=0x0000000000000000, R13=0x000000002d294520, R14=0x000000002f21edb0, R15=0x000000002a55b800
RIP=0x0000000000000000, EFLAGS=0x0000000000010246
Top of Stack: (sp=0x000000002f21ebe8)
0x000000002f21ebe8: 0000000180026a81 0000000001463c60
0x000000002f21ebf8: 000000002f21ec38 cccccccccccccccc
0x000000002f21ec08: cccccccccccccccc 000000002e9f8b10
0x000000002f21ec18: cccccccccccccccc cccccccc00000000
0x000000002f21ec28: cccccccccccccccc cccccccccccccccc
0x000000002f21ec38: 0000000001463c60 cccccccccccccccc
0x000000002f21ec48: fffffffffffffffe cccccccccccccccc
0x000000002f21ec58: cccccccccccccccc 000000002f21ecb0
0x000000002f21ec68: 000000002df52337 0000000001463c60
0x000000002f21ec78: 000000002f21ed01 0000000000000001
0x000000002f21ec88: 000000002a488ca0 000000002e9f8b10
0x000000002f21ec98: cccccccccccccccc 000000002a488ca0
0x000000002f21eca8: cccccccc00000001 0000000003987f10
0x000000002f21ecb8: 00000000039a1df0 000000002a55b9f8
0x000000002f21ecc8: 000000002f21ed70 0000000001463c60
0x000000002f21ecd8: 0000000003987f01 0000000000000001
排查
根据这行日志:
是业务代码里面有线程导致内存溢出了。
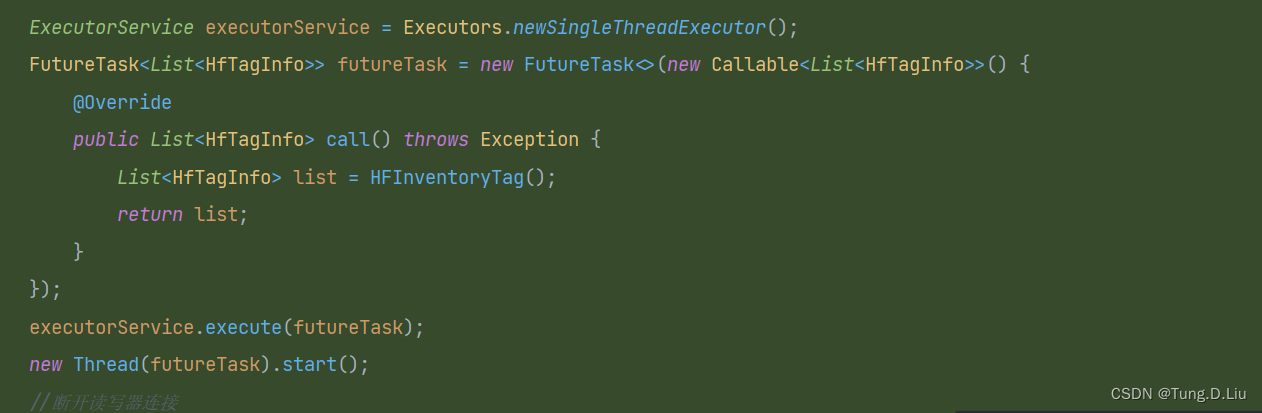
发现是Executors使用不当引起的内存泄漏。
解决
以前其实没太在意这种问题,都是使用Executors去创建线程,但是这样确实会存在一些问题,就像这些的内存泄漏,所以一般不要使用Executors去创建线程,使用ThreadPoolExecutor进行创建,其实Executors底层也是使用ThreadPoolExecutor进行创建的。
按照下面的代码正确的使用线程:
        // 阻塞队列容量声明为100个
        ThreadPoolExecutor executorService = new ThreadPoolExecutor(10, 10,
                0L, TimeUnit.MILLISECONDS, new LinkedBlockingQueue<>(100));
        // 设置拒绝策略
        executorService.setRejectedExecutionHandler(new ThreadPoolExecutor.CallerRunsPolicy());
        // 空闲队列存活时间
        executorService.setKeepAliveTime(20, TimeUnit.SECONDS);
        try {


            FutureTask<List<HfTagInfo>> futureTask = new FutureTask<>(new Callable<List<HfTagInfo>>() {


                @Override
                public List<HfTagInfo> call() throws Exception {


                    //业务代码
                }
            });
            executorService.execute(futureTask);
            new Thread(futureTask).start();
            return  futureTask.get();
        }catch (Exception e){


            e.printStackTrace();
        }finally {


            executorService.shutdown();
            executorService.awaitTermination(10, TimeUnit.SECONDS);
        }