import matplotlib.pyplot as plt
import numpy as np
from mpl_toolkits.mplot3d import Axes3D
plt.style.use('seaborn-darkgrid')
# Make data
np.random.seed(19680801)
n = 100
rng = np.random.default_rng()
xs = rng.uniform(23, 32, n)
ys = rng.uniform(0, 100, n)
zs = rng.uniform(-50, -25, n)
# Plot
fig, ax = plt.subplots(subplot_kw={
"projection": "3d"})
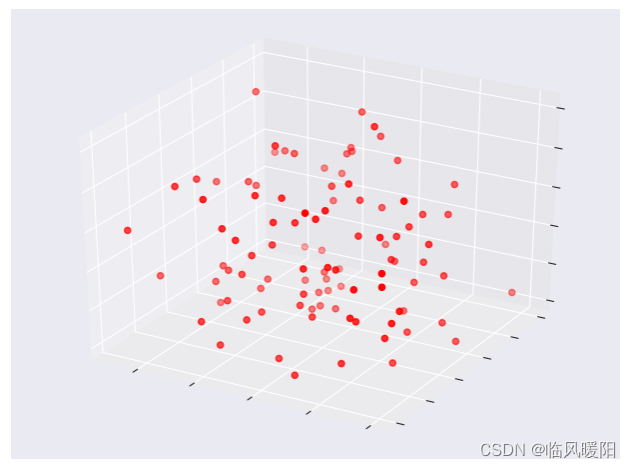
ax.scatter(xs, ys, zs,color='red')
ax.set(xticklabels=[],
yticklabels=[],
zticklabels=[])
plt.show()
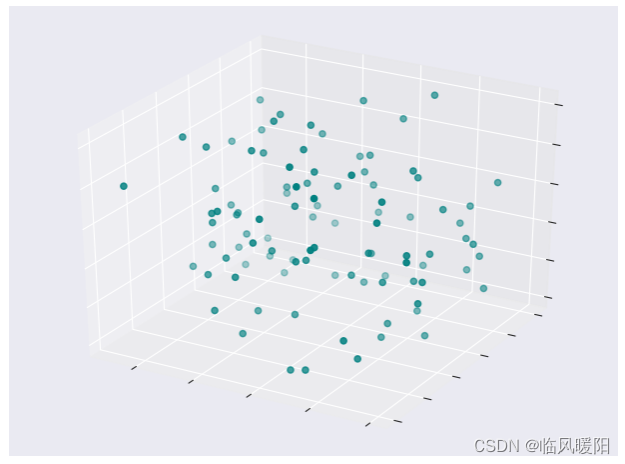
ax.scatter(xs, ys, zs,color='teal')
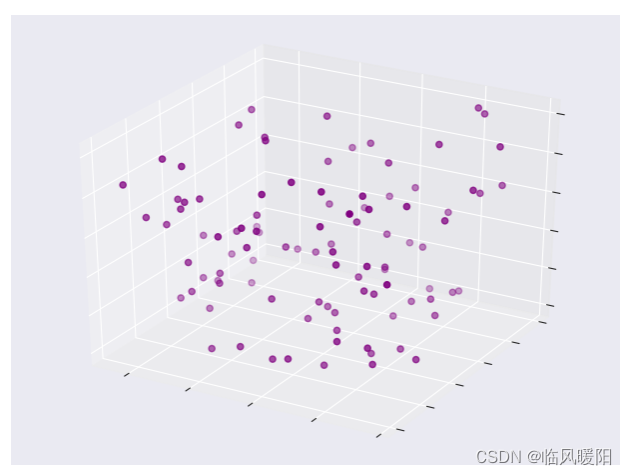
ax.scatter(xs, ys, zs,color='purple')
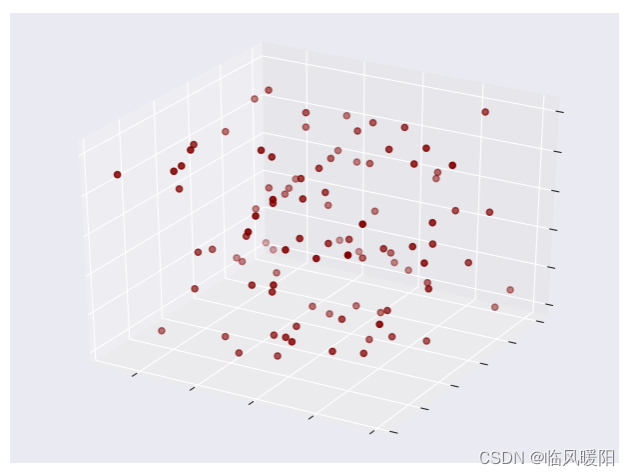
ax.scatter(xs, ys, zs,color='maroon')
参考文献:https://matplotlib.org/stable/plot_types/3D/scatter3d_simple.html