from matplotlib.offsetbox import AnchoredText
import matplotlib.pyplot as plt
import cartopy.crs as ccrs
import cartopy.feature as cfeature
import cartopy.io.shapereader as shpreader
def main():
fig = plt.figure(figsize=(12,8))
ax = fig.add_subplot(1, 1, 1, projection=ccrs.PlateCarree())
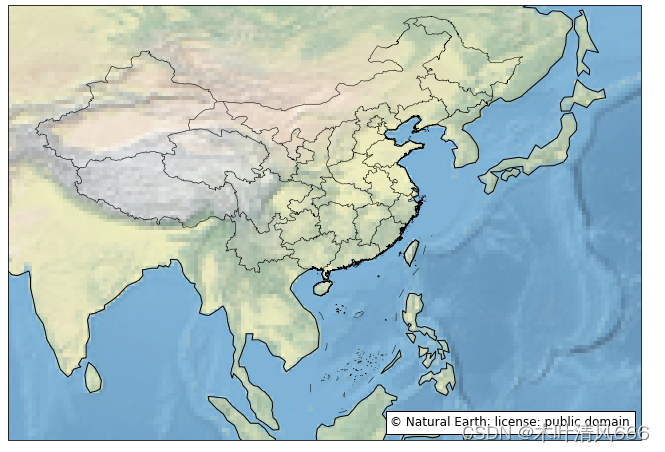
ax.set_extent([70, 150, 0, 55], crs=ccrs.PlateCarree())
ax.stock_img()
SOURCE = 'Natural Earth'
LICENSE = 'public domain'
ax.add_feature(cfeature.LAND)
ax.add_feature(cfeature.COASTLINE)
filepath = '.\bou2_4l.shp'
reader = shpreader.Reader(filepath)
geoms = reader.geometries()
ax.add_geometries(geoms, ccrs.PlateCarree(), lw=0.5, fc='none')
text = AnchoredText('\u00A9 {}; license: {}'
''.format(SOURCE, LICENSE),
loc=4, prop={
'size': 12}, frameon=True)
ax.add_artist(text)
plt.show()
if __name__ == '__main__':
main()