What's new in Flexmonster Pivot Table & Charts component 2.9.59
September 4, 2023
- NEW: The .fm-grid-header and .fm-grid-header-mobile CSS selectors were added to customize the width and height of grid sheet headers. See an example on JSFiddle.
- NEW: mapping The visible property is now available for SSAS. The property can be defined for dimensions, hierarchies, and measures.
- FIX: The issue with converting 1 to true and 0 to false when exporting the flat table to Excel was fixed.
- FIX: The issue with unicode symbols corrupting the file exported to Excel was fixed.

In the eventuality that you are processing large amounts of data and would like to be to sort the information easier, then one alternative to consider for is pivot tables. Not only do they provide you with an intuitive spreadsheet design display, but they also enable you to compare the information in seconds, find patterns and create reports efficiently.
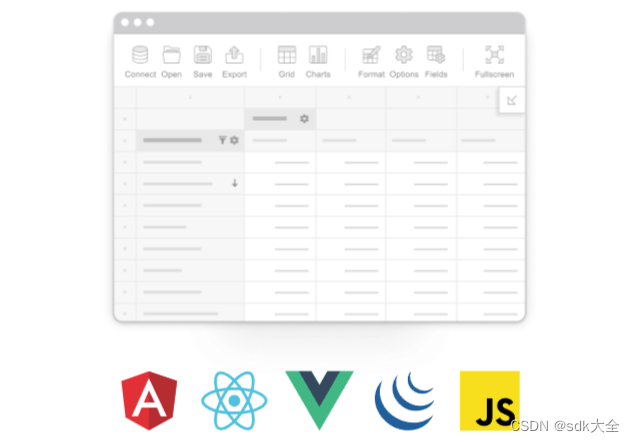
Flexmonster Pivot Table & Charts is a component specially designed for visualizing complex business data in real time. Written in JavaScript, the utility does not need extra plugins and is not limited by the type of server you are running. In fact, it is designed to integrate easily with most development frameworks available today and works seamlessly with most browsers on iOS, Windows, Android, Mac and Linux.
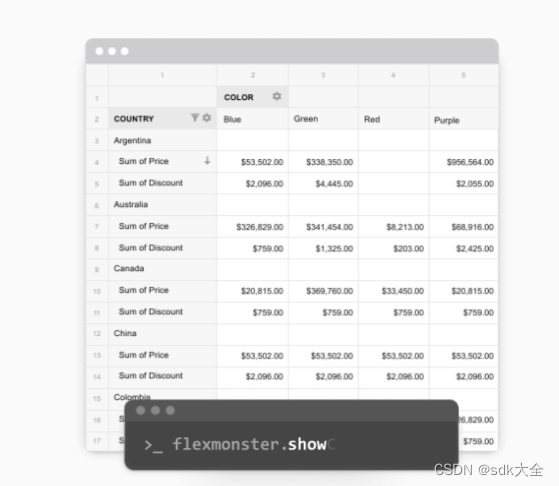
It is worth mentioning that adding this component to the website or web-based application you are compiling enables them to handle massive data sets, including OLAP cubes. Moreover, while it is compatible with most database related formats, the developing team is working to expand the support to as many data sources as possible.

A pivot table component for web reporting
The most powerful JavaScript tool for visualizing your business data
User interface
In Flexmonster Pivot, users can:
- Show data in a pivot table or visualize it using pivot charts
- Drag fields from the Field List to compose reports and add calculated values
- Filter a dataset, sort records, or drill through to see the non-aggregated data
- Use the Toolbar to access Flexmonster's features
Note This guide describes Flexmonster’s default UI, but if necessary, it can be customized and adjusted to your project’s needs. For example, you can disable existing features, manage UI controls, and change Flexmonster’s theme. Refer to the customizing section for all customization options.