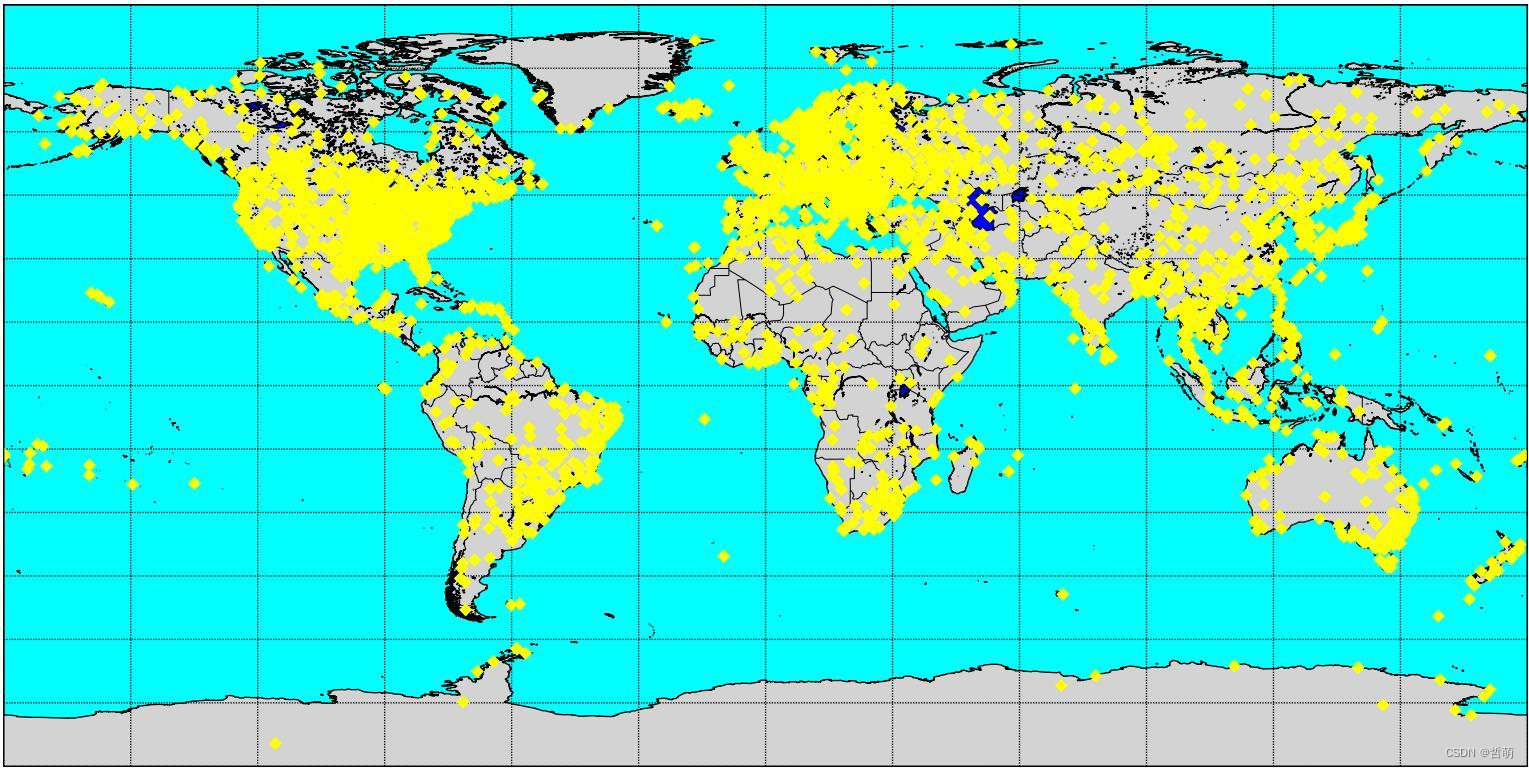
简记,使用basemap画世界地图,并用matplot标记某些坐标点
from mpl_toolkits.basemap import Basemap
import numpy as np
import matplotlib.pyplot as plt

import xlrd

def read_excel():
    file = xlrd.open_workbook(r"坐标数据.xlsx")
    table = file.sheet_by_name('Sheet1')    ##用工作表的名称来调取需要读取的数据,这里需要Sheet1里的数据
    #print(table.name, table.nrows, table.ncols)   ##用于打印工作表名称、行数、列数
    excel_data = []
    for i in range (0, table.nrows):
        row_data = table.row_values(i)
        excel_data.append(row_data)
    excel_data = np.array(excel_data)
    return excel_data

localtion = read_excel()


m = Basemap(resolution='l')     # 实例化一个map
m.drawcoastlines()  # 画海岸线
m.drawmapboundary(fill_color='aqua')
m.drawcountries()
#m.drawrivers()
m.fillcontinents(color='lightgray',lake_color='blue') # 画大洲,颜色填充为褐色

parallels = np.arange(-90., 90., 15.)  # 这两行画纬度,范围为[-90,90]间隔为10
m.drawparallels(parallels,labels=[False, True, True, False])
meridians = np.arange(-180., 180., 30.)  # 这两行画经度,范围为[-180,180]间隔为10
m.drawmeridians(meridians,labels=[True, False, False, True])

for idx in range(localtion.shape[0]):
    m.plot(localtion[idx,0],localtion[idx,1],marker='D',color='yellow')

#NA
m.plot(-77.03,38.85,marker='D',color='red')
#m.plot(-74.15,40.64,marker='D',color='red')
m.plot(-71.27,46.05,marker='D',color='red')
m.plot(-92.48,44.59,marker='D',color='red')
m.plot(-102.28,39.24,marker='D',color='red')
m.plot(-91.74,35.21,marker='D',color='red')
m.plot(-118.15,33.81,marker='D',color='red')
m.plot(-113.06,41.05,marker='D',color='red')
m.plot(-96.07,33.07,marker='D',color='red')

#EUR
m.plot(2.33,48.84,marker='D',color='red')
m.plot(0.552,51.5,marker='D',color='red')
m.plot(20.65,52.45,marker='D',color='red')
m.plot(12.33,51.43,marker='D',color='red')
m.plot(16.45,48.29,marker='D',color='red')
m.plot(-3.77,40.57,marker='D',color='red')
m.plot(12.51,43.1,marker='D',color='red')
m.plot(25.5,50.7,marker='D',color='red')

#ASIA
m.plot(118.8,32,marker='D',color='red')
m.plot(125.22,43.9,marker='D',color='red')
m.plot(116.28,39.93,marker='D',color='red')
m.plot(108.77,28.83,marker='D',color='red')
m.plot(110.35,20.03,marker='D',color='red')
m.plot(113.65,34.72,marker='D',color='red')
m.plot(75.98,39.47,marker='D',color='red')
m.plot(135.75,35.0084,marker='D',color='red')

plt.show()
画图效果如下