
一、说明
RSI是相对强弱指数(Relative Strength Index)的缩写,是一种技术指标。该指标是用来测量股票或其他交易品种的价格波动强度和速度的,属于动量型指标。RSI常用于技术分析和交易策略中,可以帮助交易者判断市场的买卖力量、价格趋势和超买超卖状况,从而制定有效的交易决策。
二、RSI 概念和特征
相对强弱指数(RSI)是衡量价格变动速度和变化的动量振荡器。它可以帮助交易者识别市场中的超买或超卖情况,表明潜在的价格反转。
动量是指价格在特定方向上变动的强度和速度。它基于以下原则:向某个方向移动的资产倾向于继续向该方向移动,直到发生重大变化。
动量振荡器是用于衡量价格变动动量和识别潜在趋势反转的技术指标。它们为交易者提供有关价格变化的速度和幅度的信息,表明资产是超买还是超卖。
动量振荡器通常在定义的上限和下限或阈值之间波动。这些阈值用于确定超买和超卖水平。当振荡器达到上限时,表明该资产可能超买,需要进行价格修正或反转。相反,当振荡器达到下边界时,它表明资产可能超卖,并且由于潜在的价格上涨或逆转。
RSI 是根据指定时间段(通常为 14 个周期)的平均收益和损失计算的。
RSI 通常用作确定特定资产是超买还是超卖的信号。如果 RSI 值超过 70,则表明该资产超买,表明潜在的卖出信号。相反,如果 RSI 值跌破 30,则表明该资产超卖,表明存在潜在的买入信号。
三、让我们在 Python 中实现 RSI
首先,让我们使用库在一小时内提取过去两年的特斯拉股价。yfinance
import yfinance as yf
from datetime import datetime, timedelta

ticker = "TSLA"

end_date = datetime.today().strftime('%Y-%m-%d')
start_date = (datetime.today() - timedelta(days=700)).strftime('%Y-%m-%d')

data = yf.download(ticker, start=start_date, end=end_date, interval='1h')
data is a Pandas DataFrame.
data.head()
我们可以使用该库来绘制烛台图。它提供了一个方便的界面,用于在 Python mplfinance 中创建财务图表
import mplfinance as mpf

mpf.plot(data, type='candle', volume=True, style='yahoo')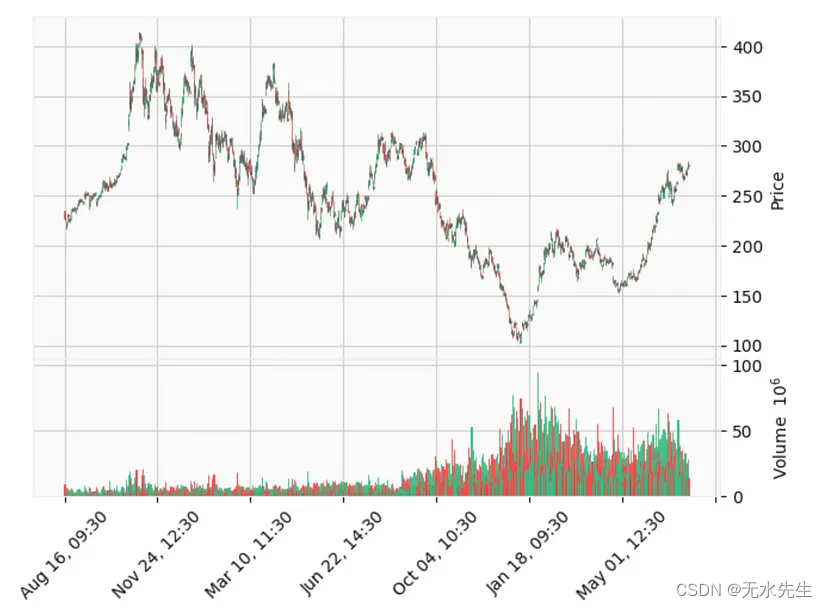
要使用提取的特斯拉股价计算 RSI(相对强弱指数),我们可以利用该库,该库提供各种技术分析指标。您可以在此处阅读库的文档。ta
pip install ta
import ta

data['RSI'] = ta.momentum.RSIIndicator(data['Close']).rsi()
import matplotlib.pyplot as plt
upper_limit = 70
lower_limit = 30
plt.figure(figsize=(10, 6))
plt.plot(data.index, data['RSI'])
plt.axhline(y=upper_limit, color='r', linestyle='--', label='Overbought (70)')
plt.axhline(y=lower_limit, color='g', linestyle='--', label='Oversold (30)')
plt.title('RSI of Tesla Stock')
plt.xlabel('Date')
plt.ylabel('RSI')
plt.legend()
plt.grid(True)
plt.show()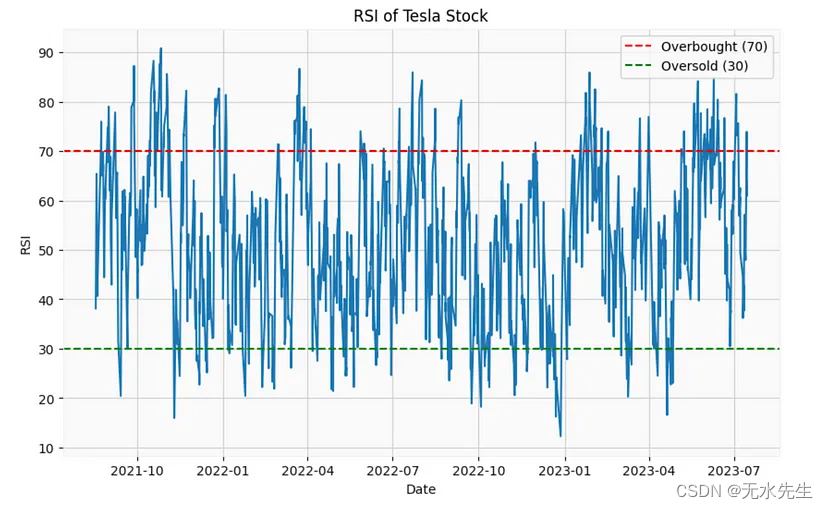
class (close: pandas.core.series.Series, window: int = 14, fillna: bool = Falseta.momentum.RSIIndicator)
四、基于RSI的模拟
让我们继续开发一个简单的买卖模拟,其中决策过程基于 RSI 指标的水平。
# Define the initial capital and track the current capital
initial_capital = 100
current_capital = initial_capital

# Define the overbought and oversold limits
overbought_limit = 70
oversold_limit = 30

# Define the initial holding status
is_holding = False

# Iterate through the RSI data and make buy/sell decisions
for i in range(1, len(data)):
    current_rsi = data['RSI'][i]
    current_price = data['Close'][i]

    if current_rsi < oversold_limit and not is_holding:
        # Buy condition
        shares_to_buy = current_capital / current_price
        current_capital = 0
        is_holding = True
        print(f"Buy {shares_to_buy} shares at {current_price} -> Rsi Level: {current_rsi}")

    elif current_rsi > overbought_limit and is_holding:
        # Sell condition
        current_capital = current_capital + (current_price * shares_to_buy)
        is_holding = False
        print(f"Sell {shares_to_buy} shares at {current_price} -> Rsi Level: {current_rsi}")

# Print the final capital
print(f"Final capital: ${current_capital}")

"""
Buy 0.4179246675736921 shares at 239.27757263183594 -> Rsi Level: 20.438411371337622
Sell 0.4179246675736921 shares at 255.51002502441406 -> Rsi Level: 73.06501350257133
Buy 0.29318660443911904 shares at 364.2183532714844 -> Rsi Level: 21.068814167529595
Sell 0.29318660443911904 shares at 379.25 -> Rsi Level: 73.41888447060789
Buy 0.32491093254899217 shares at 342.2200012207031 -> Rsi Level: 28.858062677990233
Sell 0.32491093254899217 shares at 336.93499755859375 -> Rsi Level: 75.20791184591683
Buy 0.31522318975955993 shares at 347.2900085449219 -> Rsi Level: 29.746993287658356
Sell 0.31522318975955993 shares at 289.4800109863281 -> Rsi Level: 71.37862844420539
Buy 0.35377445208463354 shares at 257.93499755859375 -> Rsi Level: 29.772071247456054
Sell 0.35377445208463354 shares at 290.6433410644531 -> Rsi Level: 70.21919190004444
Buy 0.29858345212367027 shares at 344.3666687011719 -> Rsi Level: 29.536900207208518
Sell 0.29858345212367027 shares at 249.22999572753906 -> Rsi Level: 71.8881356308825
Buy 0.3437808677391333 shares at 216.4633331298828 -> Rsi Level: 26.68961190834922
Sell 0.3437808677391333 shares at 241.20948791503906 -> Rsi Level: 70.19284733253295
Buy 0.3673613408605083 shares at 225.72654724121094 -> Rsi Level: 27.518762067733604
Sell 0.3673613408605083 shares at 243.37489318847656 -> Rsi Level: 70.28410255957843
Buy 0.3106414061007942 shares at 287.8126525878906 -> Rsi Level: 27.98065596331672
Sell 0.3106414061007942 shares at 296.7300109863281 -> Rsi Level: 75.46276500115341
Buy 0.3146013733382365 shares at 292.9949951171875 -> Rsi Level: 28.658808113058043
Sell 0.3146013733382365 shares at 194.70750427246094 -> Rsi Level: 71.7396674122882
Buy 0.35403564172219 shares at 173.02000427246094 -> Rsi Level: 29.771767028843456
Sell 0.35403564172219 shares at 129.5399932861328 -> Rsi Level: 70.25768896760097
Buy 0.24320177857052705 shares at 188.5749969482422 -> Rsi Level: 28.61856076775159
Sell 0.24320177857052705 shares at 193.75999450683594 -> Rsi Level: 71.66246679110026
Buy 0.26485879610225227 shares at 177.91659545898438 -> Rsi Level: 24.541752420541684
Sell 0.26485879610225227 shares at 170.13180541992188 -> Rsi Level: 70.36655102514713
Final capital: $45.06090516222314
"""我们从100美元的初始资本开始,经历了65美元的损失。
交易者经常使用 RSI 作为识别市场潜在进入和退出点的工具。重要的是要注意,RSI应与其他技术分析工具和风险管理策略结合使用,以做出明智的交易决策。