一、安装Echarts
Echarts官网:https://echarts.apache.org/handbook/zh/basics/download/
npm install echarts --save 或 yarn add echarts
二、基本示例
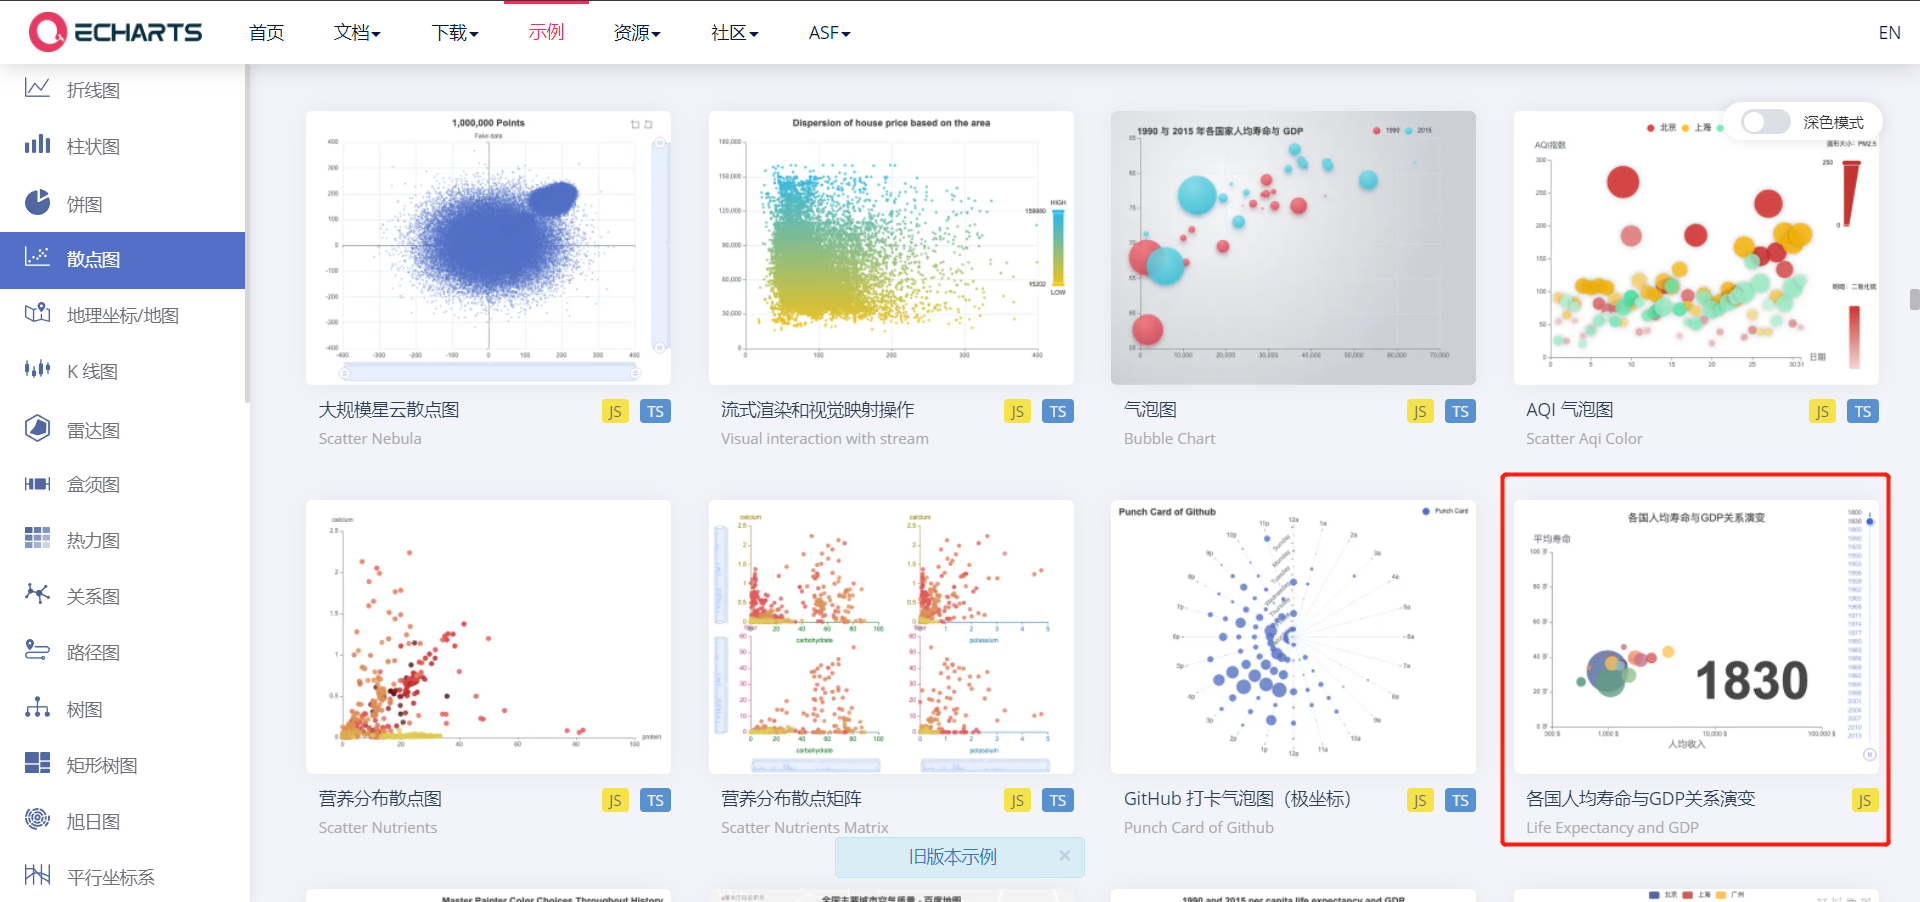
在Echarts示例位置找到自己项目需要的图例,地址:https://echarts.apache.org/examples/zh/index.html#chart-type-scatter
该示例是基本示例,可以通过Echats的 配置项手册进行图表的修改
三、React项目导入
1、版本配置
本处的案例使用的相关构建框架是 vite + axios + react + sass,在版本上有的时候可能容易出现问题,因此这里也把相关的版本号写出做出说明,避免因为版本出现报错
{
  "name": "vite-react",
  "version": "0.0.0",
  "scripts": {
    "dev": "vite",
    "build": "vite build",
    "serve": "vite preview"
  },
  "dependencies": {
    "antd": "^4.16.13",
    "axios": "^0.24.0",
    "crypto": "^1.0.1",
    "crypto-js": "^4.1.1",
    "echarts": "^5.2.2",
    "js-md5": "^0.7.3",
    "pubsub-js": "^1.9.4",
    "react": "^17.0.0",
    "react-dom": "^17.0.0",
    "react-router-dom": "^5.2.0",
    "node-sass": "^4.14.1",
    "sass": "^1.43.4"
  },
  "devDependencies": {
    "@vitejs/plugin-react": "^1.0.0",
    "vite": "^2.6.4"
  }
}
2、Echarts导入
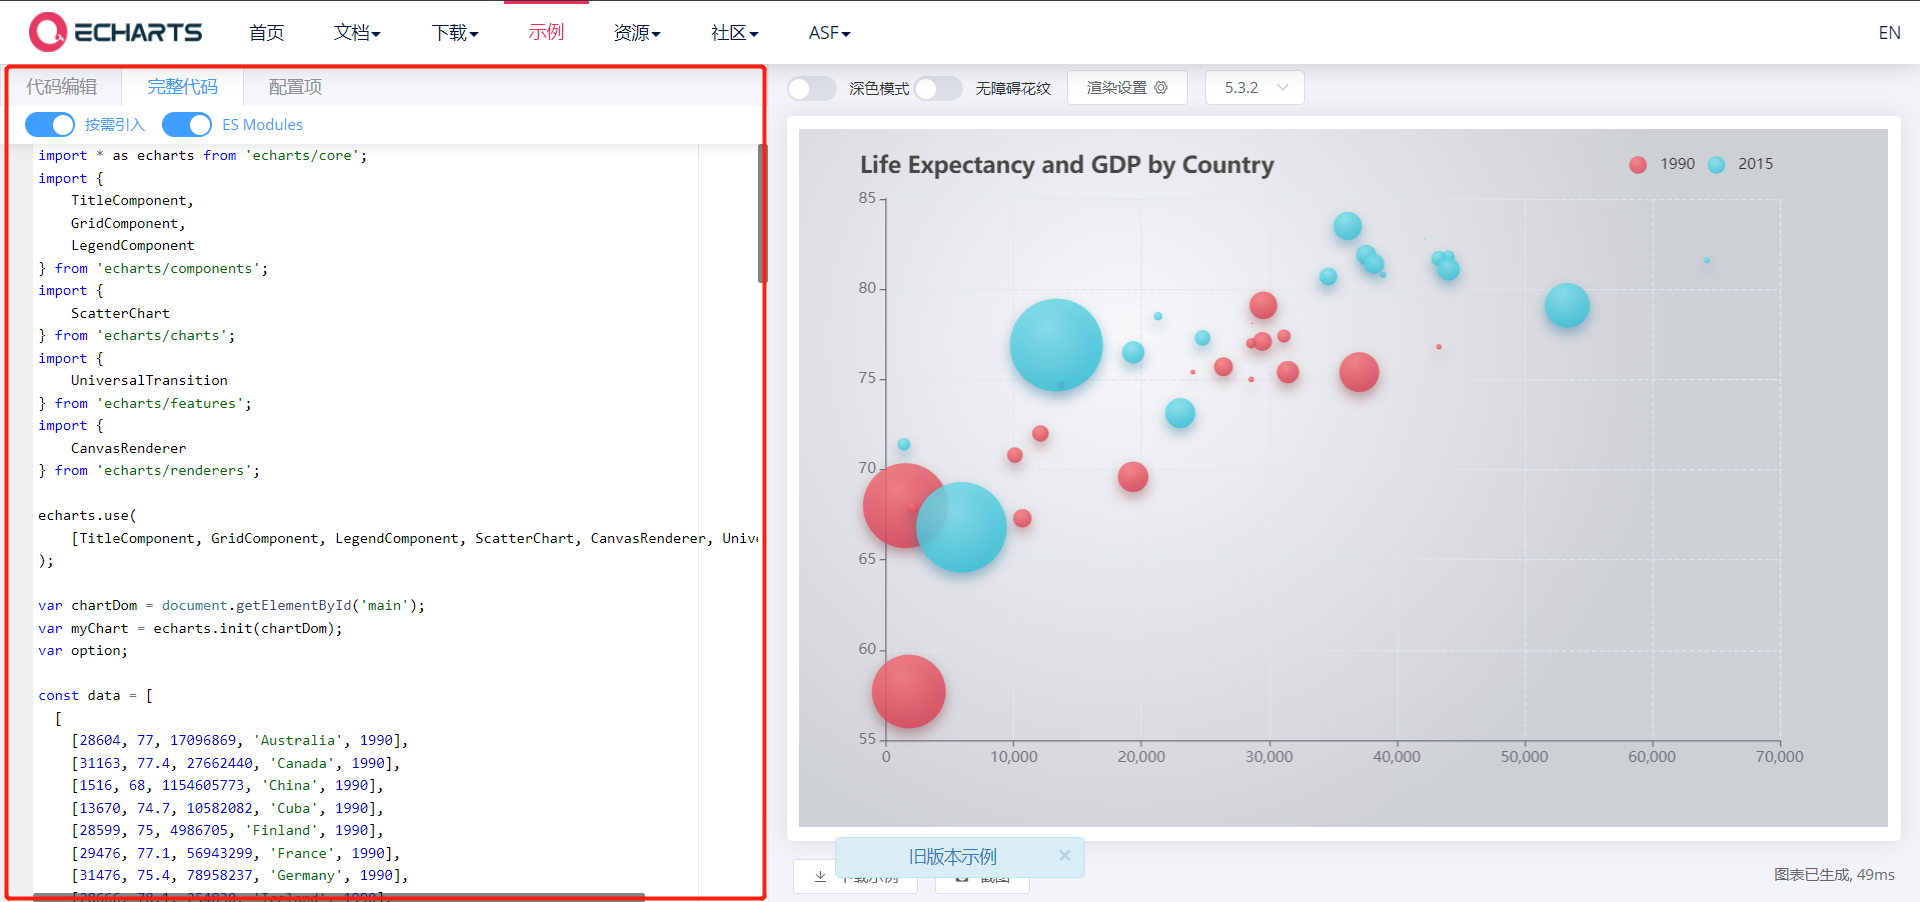
直接复制下图红框中的代码到项目中
3、项目实际导入
新建一个react组件,将其命名为 xxxEcharts.jsx (用typescript的是 后缀名为 .tsx),这里需要使用react的生命周期函数,如果使用的是类式组件,可以直接将代码复制到类式组件的 componentDidMount()钩子函数中,具体的使用方法可以参考 react生命周期钩子函数
建议使用的是函数式组件,性能上会更好一些
下面的源码示例为 jsx 示例代码,使用的组件是函数式组件
import React from 'react';
import axios from 'axios';
import * as echarts from 'echarts/core';
import {


  TimelineComponent,
  TitleComponent,
  TooltipComponent,
  GridComponent,
  VisualMapComponent
} from 'echarts/components';
import {

     ScatterChart } from 'echarts/charts';
import {

     UniversalTransition } from 'echarts/features';
import {

     CanvasRenderer } from 'echarts/renderers';

echarts.use([
  TimelineComponent,
  TitleComponent,
  TooltipComponent,
  GridComponent,
  VisualMapComponent,
  ScatterChart,
  CanvasRenderer,
  UniversalTransition
]);

import '../EchartsGlobal.sass'//本地的sass文件,作用是设置图表的大小

export default function ChartsScatter () {


  React.useEffect(() => {


    var ROOT_PATH =
      'https://cdn.jsdelivr.net/gh/apache/echarts-website@asf-site/examples';

    var chartDom = document.getElementById('scatter');
    var myChart = echarts.init(chartDom);
    var option;

    myChart.showLoading();
    axios.get(ROOT_PATH + '/data/asset/data/life-expectancy.json').then( response =>{


      var data = response.data
      myChart.hideLoading();
      var itemStyle = {


        opacity: 0.8
      };
      var sizeFunction = function (x) {


        var y = Math.sqrt(x / 5e8) + 0.1;
        return y * 80;
      };
      // Schema:
      var schema = [
        {

     name: 'Income', index: 0, text: '人均收入', unit: '美元' },
        {

     name: 'LifeExpectancy', index: 1, text: '人均寿命', unit: '岁' },
        {

     name: 'Population', index: 2, text: '总人口', unit: '' },
        {

     name: 'Country', index: 3, text: '国家', unit: '' }
      ];
      option = {


        baseOption: {


          timeline: {


            axisType: 'category',
            orient: 'vertical',
            autoPlay: true,
            inverse: true,
            playInterval: 1000,
            left: null,
            right: 0,
            top: 20,
            bottom: 20,
            width: 55,
            height: null,
            symbol: 'none',
            checkpointStyle: {


              borderWidth: 2
            },
            controlStyle: {


              showNextBtn: false,
              showPrevBtn: false
            },
            data: []
          },
          title: [
            {


              text: data.timeline[0],
              textAlign: 'center',
              left: '63%',
              top: '55%',
              textStyle: {


                fontSize: 100
              }
            },
            {


              text: '各国人均寿命与GDP关系演变',
              left: 'center',
              top: 10,
              textStyle: {


                fontWeight: 'normal',
                fontSize: 20
              }
            }
          ],
          tooltip: {


            padding: 5,
            borderWidth: 1,
            formatter: function (obj) {


              var value = obj.value;
              // prettier-ignore
              return schema[3].text + ':' + value[3] + '<br>'
                + schema[1].text + ':' + value[1] + schema[1].unit + '<br>'
                + schema[0].text + ':' + value[0] + schema[0].unit + '<br>'
                + schema[2].text + ':' + value[2] + '<br>';
            }
          },
          grid: {


            top: 100,
            containLabel: true,
            left: 30,
            right: '110'
          },
          xAxis: {


            type: 'log',
            name: '人均收入',
            max: 100000,
            min: 300,
            nameGap: 25,
            nameLocation: 'middle',
            nameTextStyle: {


              fontSize: 18
            },
            splitLine: {


              show: false
            },
            axisLabel: {


              formatter: '{value} $'
            }
          },
          yAxis: {


            type: 'value',
            name: '平均寿命',
            max: 100,
            nameTextStyle: {


              fontSize: 18
            },
            splitLine: {


              show: false
            },
            axisLabel: {


              formatter: '{value} 岁'
            }
          },
          visualMap: [
            {


              show: false,
              dimension: 3,
              categories: data.counties,
              inRange: {


                color: (function () {


                  // prettier-ignore
                  var colors = ['#51689b', '#ce5c5c', '#fbc357', '#8fbf8f', '#659d84', '#fb8e6a', '#c77288', '#786090', '#91c4c5', '#6890ba'];
                  return colors.concat(colors);
                })()
              }
            }
          ],
          series: [
            {


              type: 'scatter',
              itemStyle: itemStyle,
              data: data.series[0],
              symbolSize: function (val) {


                return sizeFunction(val[2]);
              }
            }
          ],
          animationDurationUpdate: 1000,
          animationEasingUpdate: 'quinticInOut'
        },
        options: []
      };
      for (var n = 0; n < data.timeline.length; n++) {


        option.baseOption.timeline.data.push(data.timeline[n]);
        option.options.push({


          title: {


            show: true,
            text: data.timeline[n] + ''
          },
          series: {


            name: data.timeline[n],
            type: 'scatter',
            itemStyle: itemStyle,
            data: data.series[n],
            symbolSize: function (val) {


              return sizeFunction(val[2]);
            }
          }
        });
      }
      myChart.setOption(option);
    })
    // function (data) {


    // });

    option && myChart.setOption(option);
  })

  return (
    <div className='echarts'>
      <div id="scatter" className='chart'></div>
    </div>
  )
}
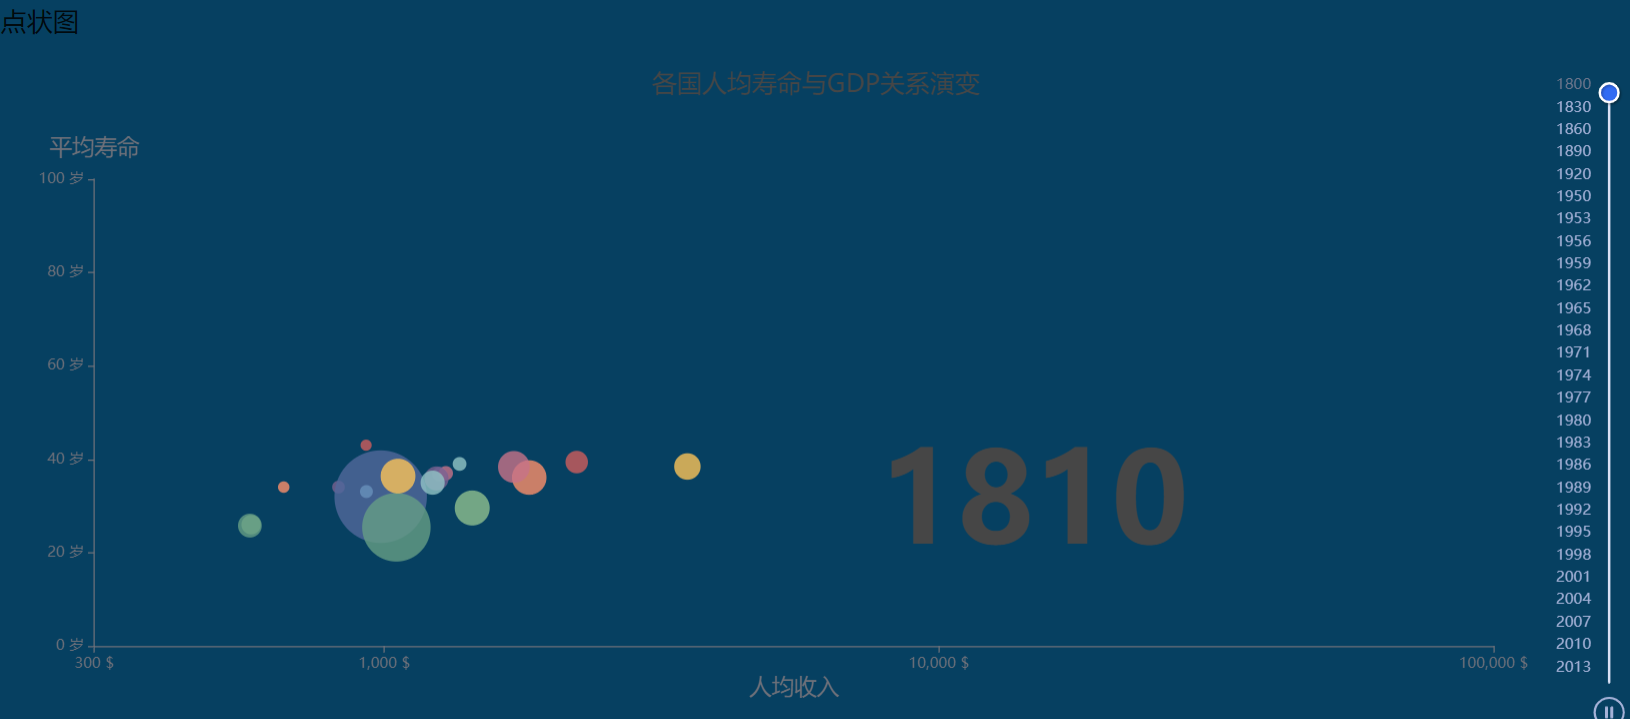
四、图表基本展示