打开系统语言设置
adb shell am start -a android.settings.LOCALE_SETTINGS
打开点按和指针显示
#为触摸操作提供视觉提示:触摸点 【0: 关闭点按显示,1: 开启点按显示】
adb shell settings put system show_touches 1
adb shell settings put system show_touches 0

# 屏幕叠加层显示当前触摸数据:坐标【0: 关闭指针显示,1: 开启指针显示】
adb shell settings put system pointer_location 1
adb shell settings put system pointer_location 0
一、开启 GPU Render 的profiling bar: Gpu渲染速度
adb shell setprop debug.hwui.profile true
adb shell setprop debug.hwui.profile visual_bars
adb shell setprop debug.hwui.profile visual_lines

adb shell setprop debug.hwui.profile false

#控制汇总条长度
adb shell setprop debug.hwui.profile.maxframes 400
效果如下:
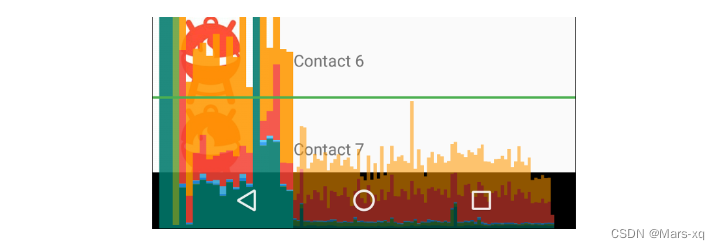
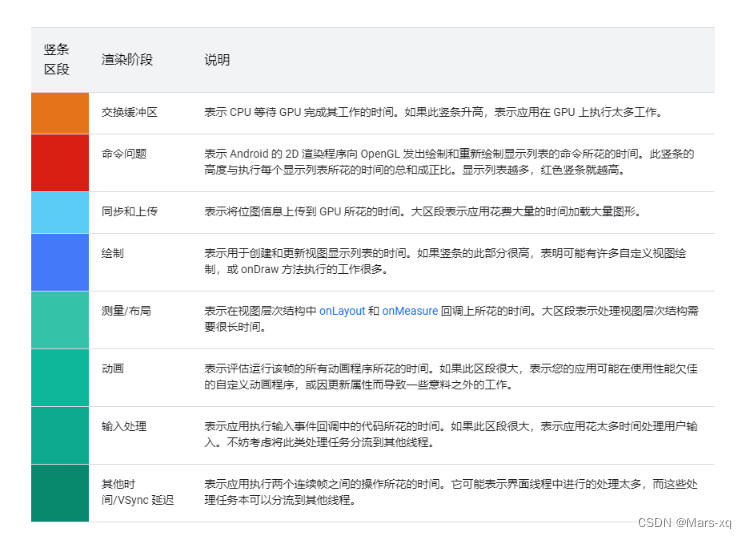
其中, Android 6.0 及更高版本的设备时分析器输出中某个竖条的每个区段如下所示:
下表显示的是 Android 4.0 和 5.0 中的竖条区段。

系统源码 :
/**
 * System property used to enable or disable hardware rendering profiling.
 * The default value of this property is assumed to be false.
 * When profiling is enabled, the adb shell dumpsys gfxinfo command will
 * output extra information about the time taken to execute by the last
 * frames.
 * Possible values:
 * "true",        to enable profiling
 * "visual_bars", to enable profiling and visualize the results on screen
 * "false",       to disable profiling
 * @see #PROFILE_PROPERTY_VISUALIZE_BARS
 * @hide
 */
public static final String PROFILE_PROPERTY = "debug.hwui.profile";
/**
 * System property used to specify the number of frames to be used
 * when doing hardware rendering profiling.
 * The default value of this property is #PROFILE_MAX_FRAMES.
 *
 * When profiling is enabled, the adb shell dumpsys gfxinfo command will
 * output extra information about the time taken to execute by the last
 * frames.
 *
 * Possible values:
 * "60", to set the limit of frames to 60
 */
static final String PROFILE_MAXFRAMES_PROPERTY = "debug.hwui.profile.maxframes";
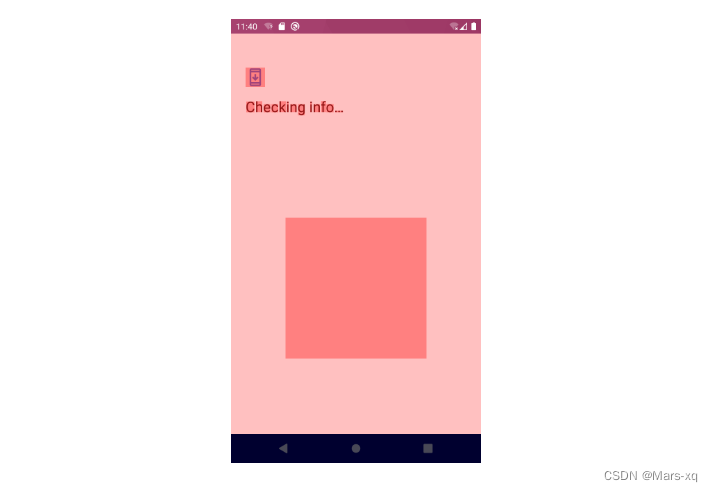
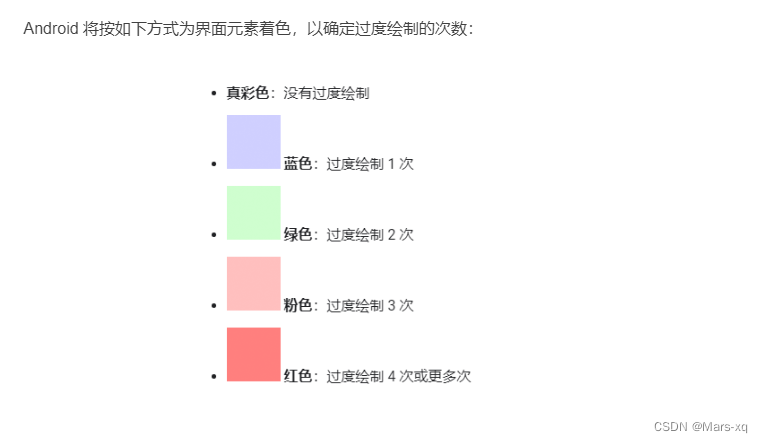
二、打开 Overdraw 检查 : GPU过度绘制
adb shell setprop debug.hwui.overdraw show

#

adb shell setprop debug.hwui.overdraw false
系统源码:
/*
 * Controls overdraw debugging.
 *
 * Possible values:
 * "false", to disable overdraw debugging
 * "show",  to show overdraw areas on screen
 * "count", to display an overdraw counter
 *
 * @hide
 */
public static final String DEBUG_OVERDRAW_PROPERTY = "debug.hwui.overdraw";
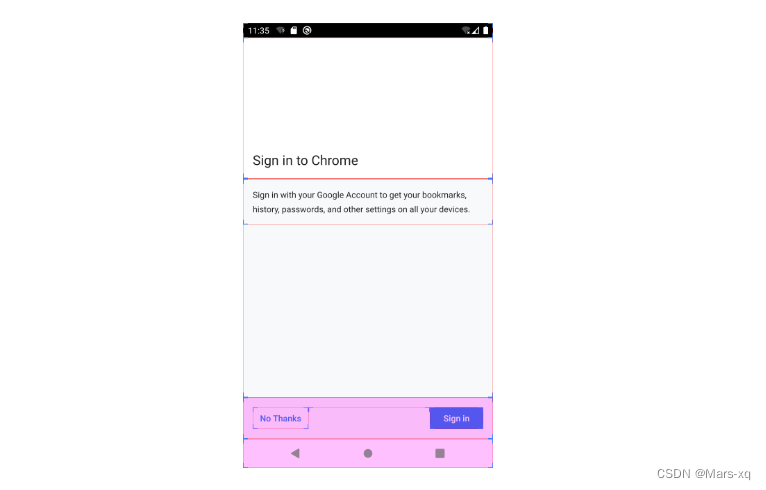
三、开启显示各个view的布局线 : 布局边界
adb shell setprop debug.layout true

#

adb shell setprop debug.layout false
系统源码 :
/**
 * When set to true, apps will draw debugging information about their layouts.
 *
 * @hide
 */
public static final String DEBUG_LAYOUT_PROPERTY = "debug.layout";
四、查看dirty区域:
adb shell setprop debug.hwui.show_dirty_regions true

adb shell setprop debug.hwui.render_dirty_regions true
系统源码:
/**
* System property used to enable or disable dirty regions invalidation.
* This property is only queried if {@link #RENDER_DIRTY_REGIONS} is true.
* The default value of this property is assumed to be true.
*
* Possible values:
* "true",  to enable partial invalidates
* "false", to disable partial invalidates
*/
static final String RENDER_DIRTY_REGIONS_PROPERTY = "debug.hwui.render_dirty_regions";


/**
* Turn on to draw dirty regions every other frame.
*
* Possible values:
* "true",  to enable dirty regions debugging
* "false", to disable dirty regions debugging
*
* @hide
*/
public static final String DEBUG_DIRTY_REGIONS_PROPERTY = "debug.hwui.show_dirty_regions";
五、log日志
# 使能所有log tag 输出,设置所有log V等级及以上的log才能输出
adb shell setprop persist.log.tag V