首先,你需要在你的WPF项目中安装LiveCharts NuGet包。你可以通过NuGet包管理器搜索“LiveCharts.Wpf”来安装它。
然后,在XAML文件中添加一个CartesianChart控件:
<Window x:Class="WpfApp12.MainWindow"
        xmlns="http://schemas.microsoft.com/winfx/2006/xaml/presentation"
        xmlns:x="http://schemas.microsoft.com/winfx/2006/xaml"
        xmlns:d="http://schemas.microsoft.com/expression/blend/2008"
        xmlns:mc="http://schemas.openxmlformats.org/markup-compatibility/2006"
        xmlns:lvc="clr-namespace:LiveCharts.Wpf;assembly=LiveCharts.Wpf"
        xmlns:local="clr-namespace:WpfApp12"
        mc:Ignorable="d"
        Title="MainWindow" Height="450" Width="800">
    <Grid>
        <lvc:CartesianChart Series="{Binding SeriesCollection}" LegendLocation="Right"/>
    </Grid>
</Window>
接下来,在你的ViewModel类中创建一个SeriesCollection属性,并在构造函数中初始化它:
using LiveCharts;
using LiveCharts.Wpf;
public class MainViewModel
{
public SeriesCollection SeriesCollection { get; set; }
public MainViewModel()
{
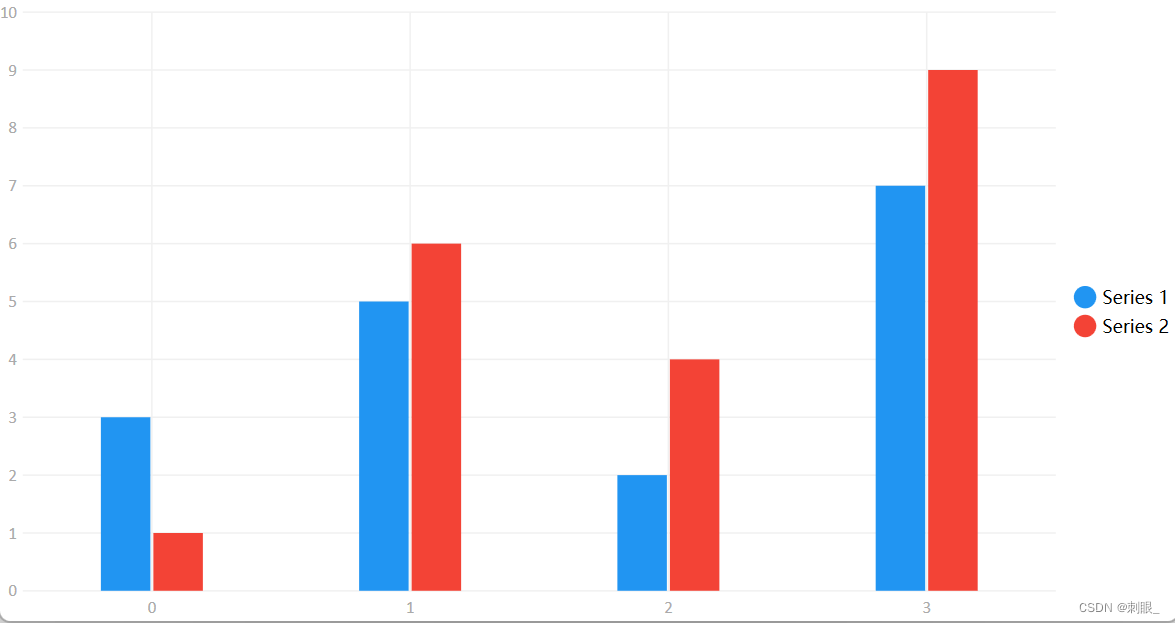
SeriesCollection = new SeriesCollection
{
new ColumnSeries
{
Title = "Series 1",
Values = new ChartValues<double> { 3, 5, 2, 7 }
}
,
new ColumnSeries
{
Title = "Series 2",
Values = new ChartValues<double> { 1, 6, 4, 9 }
}
};
}
}这里我们创建了一个包含一个ColumnSeries的SeriesCollection。ColumnSeries表示柱状图,Title属性是这个系列的标题,Values属性是这个系列的数据。
最后,在MainWindow的构造函数中将ViewModel设置为DataContext:
public MainWindow()
{
    InitializeComponent();
    DataContext = new MainViewModel();
}
现在你应该可以运行这个程序并看到一个简单的柱状图: