本篇主要练习了下载和处理json格式的文件,并通过pygal中的地图工具来实现数据可视化。
1.下载并提取相关数据
通过观察发现json格式的文件是一个很长的python列表,其中的每个元素都是一个字典,所以读取处理里面的数据时可以参考字典的处理方式。此外,因为pygal绘图时是需要国家国别码的,所以需要先写一个获取国别码的函数,如下所示:
from pygal.maps.world import COUNTRIES
def get_country_code(country_name):
    for code,name in COUNTRIES.items():
        if name==country_name:
            return code
    return None
获取国别码后,再提取相关数据
from country_code import get_country_code
import pygal
import json
filename='population_data.json'
#将数据加载到一个列表中
with open(filename) as f:
    pop_data=json.load(f)
    cc_populations={}
#提取所需要的2010年的人口数据
    for pop_dict in pop_data:
        if pop_dict['Year']=='2010':
            country=pop_dict['Country Name']
            population=int(float(pop_dict['Value']))
            code=get_country_code(country)
            if code:
                cc_populations[code]=population
2.通过pygal绘制世界人口地图
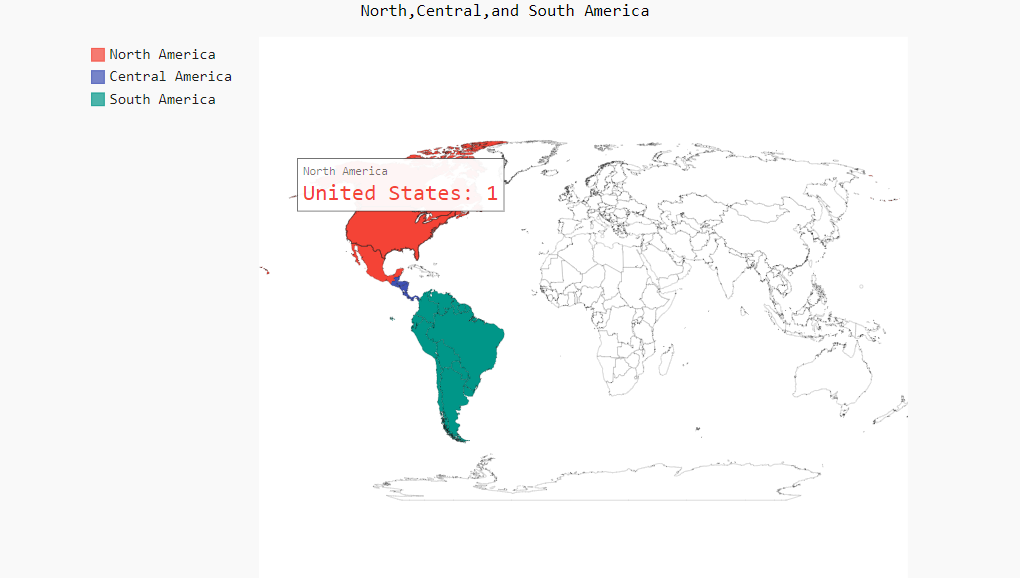
(1)在绘制世界人口地图之前,先练习了一下Worldmap的使用,绘制了一个突出北美,中美和南美的简单地图
import pygal
wm=pygal.maps.world.World()
wm.title='North,Central,and South America'
wm.add('North America',['ca','mx','us'])#North America为标签,后面为标签的值,即加拿大,墨西哥,美国的集合。
wm.add('Central America',['bz','cr','gt','hn','ni','pa','sv'])
wm.add('South America',['ar','bo','br','cl','co','ec','gf','gy','pe','py','sr','uy','ve'])
wm.render_to_file('americas.svg')
保存的是svg图片格式,有动态交互功能,当鼠标指向某一国家时,会显示这个国家的名字。因上传不了svg格式的文件,故以下为截图:
如果想鼠标指向某一国家时,除了显示国家名称,同时也显示该国家的人口,则需要修改一行代码即可。
将 :wm.add('North America',['ca','mx','us'])
改为:wm.add('North America',{'ca':3426000,'us':309349000,'mx':113423000})即可。将标签后面的内容由含有国家的列表改为含有国家信息的字典。
import pygal.maps.world
wm=pygal.maps.world.World()
wm.title=('Populations of Countries in North America')
wm.add('North America',{'ca':3426000,'us':309349000,'mx':113423000})
wm.render_to_file('na_populations.svg')
输出为(同为截图):
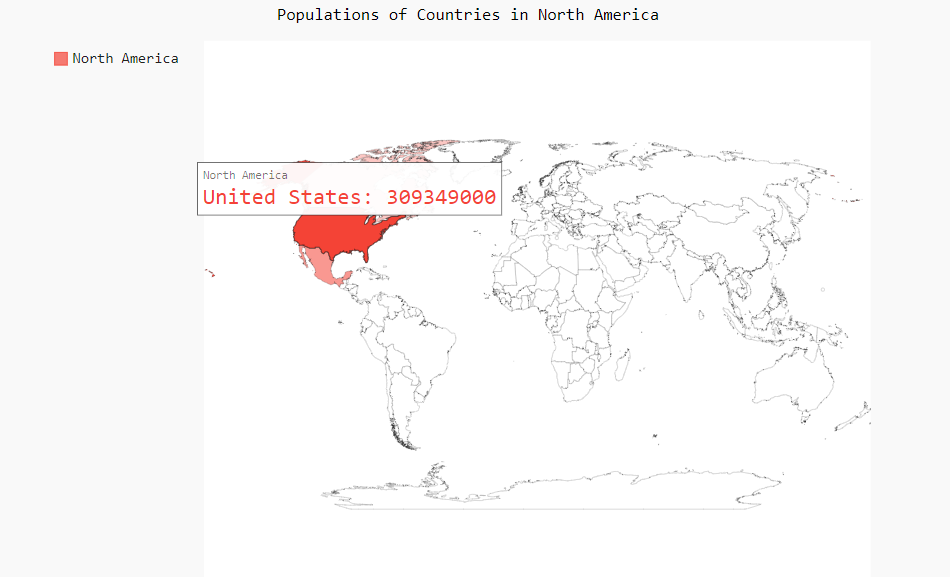
可以发现当鼠标指向某一国家时,会显示出该国家的人口。
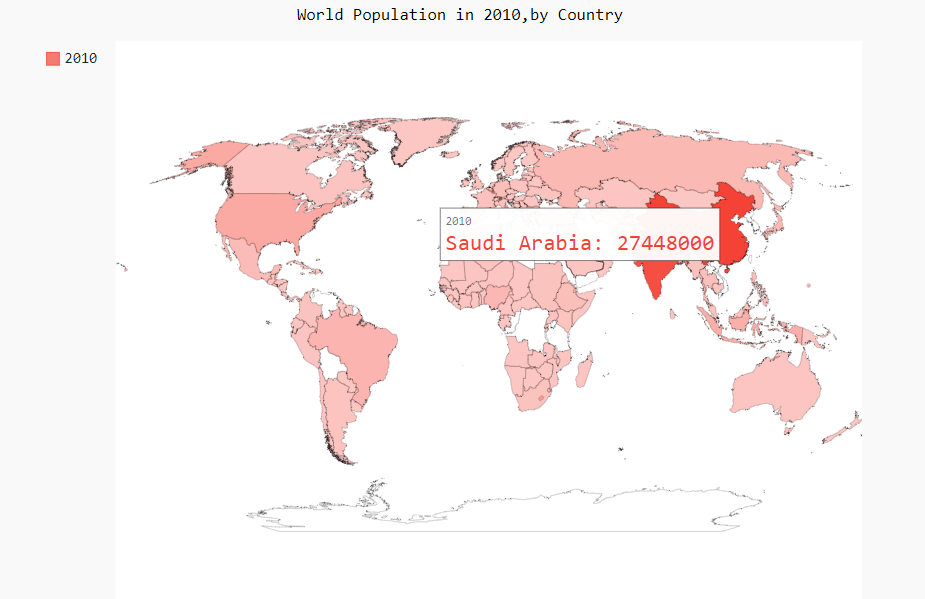
(2)接下来绘制完整的世界地图
#绘制完整世界地图
from country_code import get_country_code
import pygal
import json
filename='population_data.json'
with open(filename) as f:
    pop_data=json.load(f)
    cc_population={}
    for pop_dict in pop_data:
        if pop_dict['Year']=='2010':
            country=pop_dict['Country Name']
            population=int(float(pop_dict['Value']))
            code=get_country_code(country)
            if code:
                print(code+':'+str(population))
                cc_population[code]=population
wm=pygal.maps.world.World()
wm.title='World Population in 2010,by Country'
wm.add('2010',cc_population)
wm.render_to_file('world_population.svg')
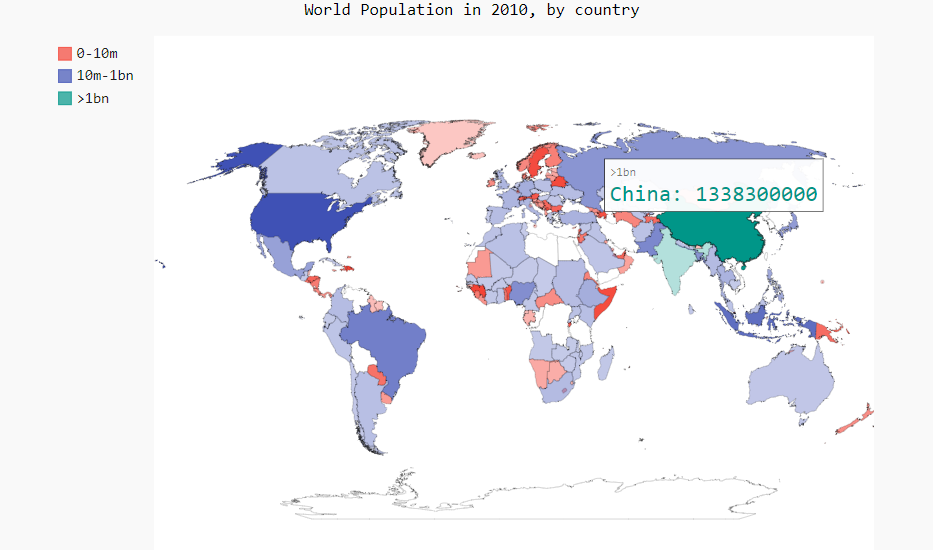
(3)根据人口将国家分组
根据人口数量将所有国家分成三组,一组是少于1000万的,二组是介于1000万和10亿之间的,三组是大于10亿的
from country_code import get_country_code
import pygal
import json
filename='population_data.json'
#将数据加载到一个列表中
with open(filename) as f:
    pop_data=json.load(f)
    cc_populations={}
#提取所需要的2010年的人口数据
    for pop_dict in pop_data:
        if pop_dict['Year']=='2010':
            country=pop_dict['Country Name']
            population=int(float(pop_dict['Value']))#因为python不能直接将包含小数点的字符串转为int型,所以需要先转为float型。
            code=get_country_code(country)
            if code:
                cc_populations[code]=population
    cc_pops1,cc_pops2,cc_pops3={},{},{}
    for cc,pop in cc_populations.items():
        if pop<10000000:
            cc_pops1[cc]=pop
        elif pop<1000000000:
            cc_pops2[cc]=pop
        else:
            cc_pops3[cc]=pop
    print(len(cc_pops1),len(cc_pops2),len(cc_pops3))
wm=pygal.maps.world.World()
wm.title='World Population in 2010, by country'
wm.add('0-10m',cc_pops1)
wm.add('10m-1bn',cc_pops2)
wm.add('>1bn',cc_pops3)
wm.render_to_file('world_populstion_by_country.svg')