我们的时间序列模型提供了一个强大的功能,允许用户在未来预测的同时检索历史预测。通过设置add_history=True参数,可以通过forecast方法访问此功能。
# Import the colab_badge module from the nixtlats.utils package
from nixtlats.utils import colab_badge
colab_badge('docs/tutorials/7_historical_forecast')
# 导入load_dotenv函数,用于加载.env文件中的环境变量
from dotenv import load_dotenv
# 加载环境变量文件
load_dotenv()
True
# 导入pandas库
import pandas as pd
# 导入TimeGPT模块
from nixtlats import TimeGPT
/home/ubuntu/miniconda/envs/nixtlats/lib/python3.11/site-packages/statsforecast/core.py:25: TqdmWarning: IProgress not found. Please update jupyter and ipywidgets. See https://ipywidgets.readthedocs.io/en/stable/user_install.html
  from tqdm.autonotebook import tqdm
# 导入TimeGPT类

# 创建一个TimeGPT对象,传入一个参数token,用于身份验证
# 如果没有提供token参数,则默认使用环境变量中的TIMEGPT_TOKEN
timegpt = TimeGPT(
    token = 'my_token_provided_by_nixtla'
)
# 导入TimeGPT模型

timegpt = TimeGPT()  # 创建TimeGPT对象的实例
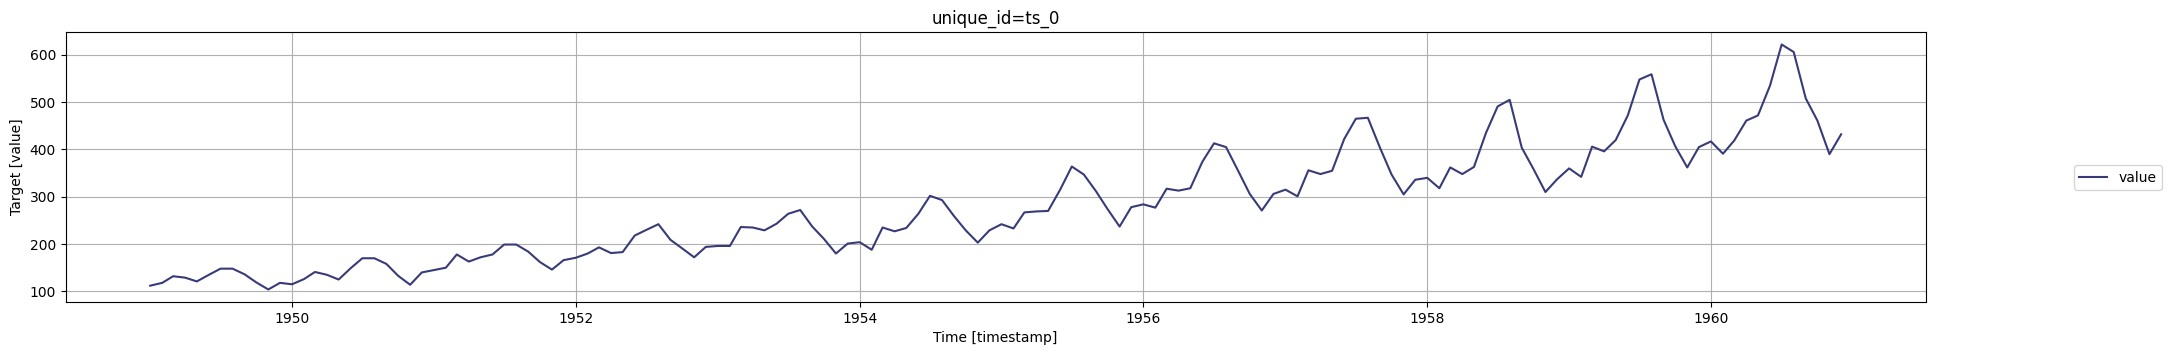
现在你可以开始进行预测了!让我们导入一个例子:
# 从指定的URL读取CSV文件,并将其存储在名为df的数据框中
df = pd.read_csv('https://raw.githubusercontent.com/Nixtla/transfer-learning-time-series/main/datasets/air_passengers.csv')

# 显示数据框的前几行
df.head()
| timestamp | value | |
|---|---|---|
| 0 | 1949-01-01 | 112 |
| 1 | 1949-02-01 | 118 |
| 2 | 1949-03-01 | 132 |
| 3 | 1949-04-01 | 129 |
| 4 | 1949-05-01 | 121 |
# 导入timegpt模块
import timegpt

# 使用timegpt模块的plot函数绘制图表
# 参数df为数据集,time_col为时间列,target_col为目标列
timegpt.plot(df, time_col='timestamp', target_col='value')
让我们添加拟合值。当add_history设置为True时,输出的DataFrame将包括不仅由h参数确定的未来预测,还包括历史预测。目前,历史预测不受h的影响,并且具有根据数据频率确定的固定时间范围。历史预测以滚动窗口方式生成并连接在一起。
# 导入所需的模块和函数

# 使用timegpt模型对给定的数据进行预测
# 参数:
# - df: 输入的数据框,包含时间戳和目标值
# - h: 预测的时间步长
# - time_col: 时间戳所在的列名
# - target_col: 目标值所在的列名
# - add_history: 是否将历史数据添加到预测结果中
# 返回值:
# - timegpt_fcst_with_history_df: 包含预测结果和历史数据的数据框
timegpt_fcst_with_history_df = timegpt.forecast(
    df=df, h=12, time_col='timestamp', target_col='value',
    add_history=True,
)
INFO:nixtlats.timegpt:Validating inputs...
INFO:nixtlats.timegpt:Preprocessing dataframes...
INFO:nixtlats.timegpt:Inferred freq: MS
INFO:nixtlats.timegpt:Calling Forecast Endpoint...
INFO:nixtlats.timegpt:Calling Historical Forecast Endpoint...
# 查看数据的前几行
timegpt_fcst_with_history_df.head()
| timestamp | TimeGPT | |
|---|---|---|
| 0 | 1951-01-01 | 135.483673 |
| 1 | 1951-02-01 | 144.442398 |
| 2 | 1951-03-01 | 157.191910 |
| 3 | 1951-04-01 | 148.769363 |
| 4 | 1951-05-01 | 140.472946 |
让我们绘制结果。过去和未来预测的这种综合视图对于理解模型的行为以及随时间评估其性能非常有价值。
# 使用timegpt模块中的plot函数绘制图表
# 参数df为原始数据集
# 参数timegpt_fcst_with_history_df为包含预测结果和历史数据的数据集
# 参数time_col指定时间列的名称
# 参数target_col指定目标列的名称
timegpt.plot(df, timegpt_fcst_with_history_df, time_col='timestamp', target_col='value')
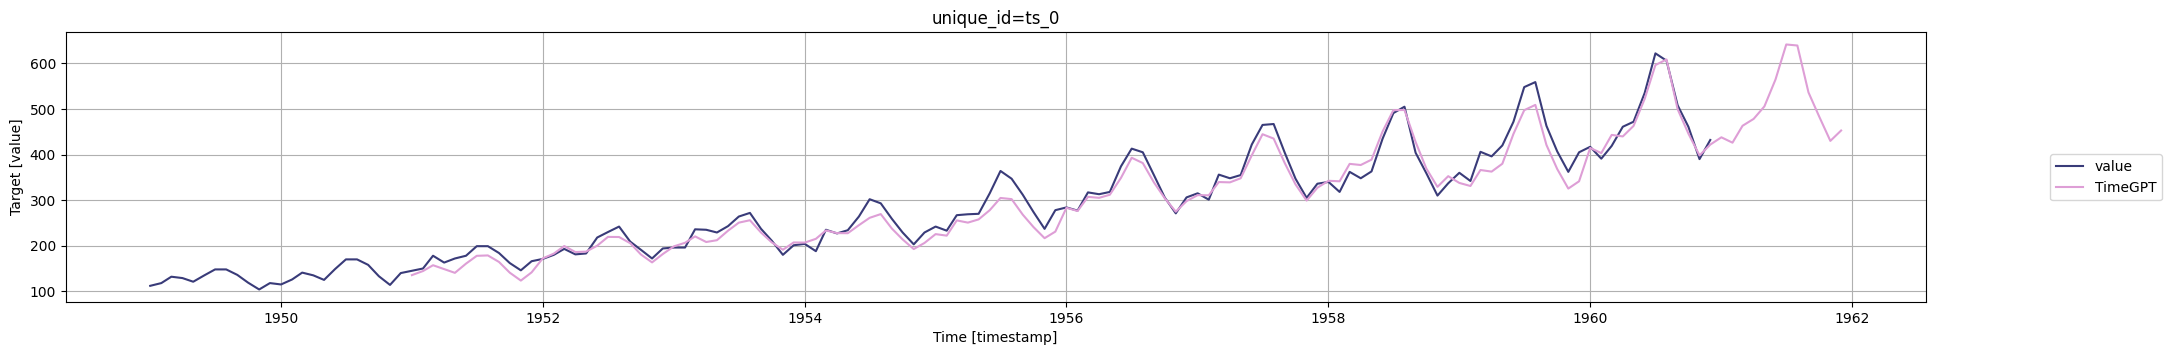
请注意,然而,这些历史预测中不包括系列的初始值。这是因为我们的模型TimeGPT需要一定数量的初始观察来生成可靠的预测。因此,在解释输出时,重要的是要意识到前几个观察值作为模型预测的基础,并不是预测值本身。