# -*- coding: utf-8 -*-
import tensorflow as tf
graph=tf.Graph()
with graph.as_default():
#定义了总的训练步数,和输出值的累加求和参数
    with tf.name_scope('variables'):
        global_step=tf.Variable(0,dtype=tf.int32,trainable=False,name='global_step')
        total_output=tf.Variable(0.0,dtype=tf.float32,trainable=False,name='total_output')
#定义了整个计算图
    with tf.name_scope('transformation'):
#定义计算图里面的输入占位符,shape可以任意的
        with tf.name_scope('input'):
            a=tf.placeholder(tf.float32,shape=[None],name='input_placeholder_a')
#定义了计算图里面的操作先是a矩阵元素累乘得b,a矩阵元素求和得c
        with tf.name_scope('intermediate_layer'):
            b=tf.reduce_prod(a,name='product_b')
            c=tf.reduce_sum(a,name='sum_c')
#定义了计算图里面的最终输出操作,将上面的b+c得输出值
        with tf.name_scope('ouput'):
            output=tf.add(b,c,name='ouput')
#更新整体变量,总的训练步数,和输出值的累加求和参数
    with tf.name_scope('update'):
        update_total=total_output.assign_add(output)
        increment_step=global_step.assign_add(1)
#利用上面的计算结果,生成3个张量的折线图
    with tf.name_scope('summaries'):
        avg=tf.div(update_total,tf.cast(increment_step,tf.float32),name='average') tf.summary.scalar('output_summary',output,)
        tf.summary.scalar('total_summary',update_total)
        tf.summary.scalar('average_summary',avg)

#初始化所有变量,并且将3个折线数据汇总
    with tf.name_scope('global_ops'):
        init=tf.initialize_all_variables()
        merged_summaries=tf.summary.merge_all()
#开启会话,才能真正的计算,指定会话建立在自己生成的图上。打开一个writer对象,指定要记录‘’保存数据的计算图和保存路径,没有该文件会自动生成,里面是events.out开头的文件
	sess=tf.Session(graph=graph)
	sess.run(init)
#将计算图数据写入events文件,就可以看到计算图的可视化
	writer=tf.summary.FileWriter('./improved_graph',graph)

#定义一个train的函数,要想获得值,必须得sess.run()才能得到。其次定义了placeholder张量,必须feed——dict值是占位符指定同类型的数据进去,键是占位符的名字
	def run_graph(input_tensor):
    	     feeddict={a:input_tensor}
#表示3个张量数据汇总以后,获得具体的值
             _,step,summary=sess.run([output,increment_step,merged_summaries],feed_dict=feeddict)

#将3个张量的折线数据也写入events文件,并指定折线的x轴,就可以看到折线图可视化
	writer.add_summary(summary,global_step=step)

#开始训练
	run_graph([1,2,3])
	run_graph([11,4])
	run_graph([4,1])
#将数据写入磁盘
	writer.flush()
#关闭对象
	writer.close()
	sess.close()
以上是完整代码,可以直接运行。
但是在学习的过程中发现好多老版本函数变动问题,推荐大家去tf官方网站学习
https://tensorflow.google.cn/versions/r1.7/api_docs/java/reference/org/tensorflow/package-summary
还有一个就是中文的tf文档,不过还是有点更新太慢
https://www.w3cschool.cn/tensorflow_python/tensorflow_python-jsl62hyf.html
=================
进入Ubuntu上面你的当前Python文件目录下,improved_graph文件没有会自动生成。输入,
tensorboard --logdir='./improved_graph' --port=6008
再在远程电脑的谷歌浏览器上输入 Ubuntu系统电脑的远程IP号:6008
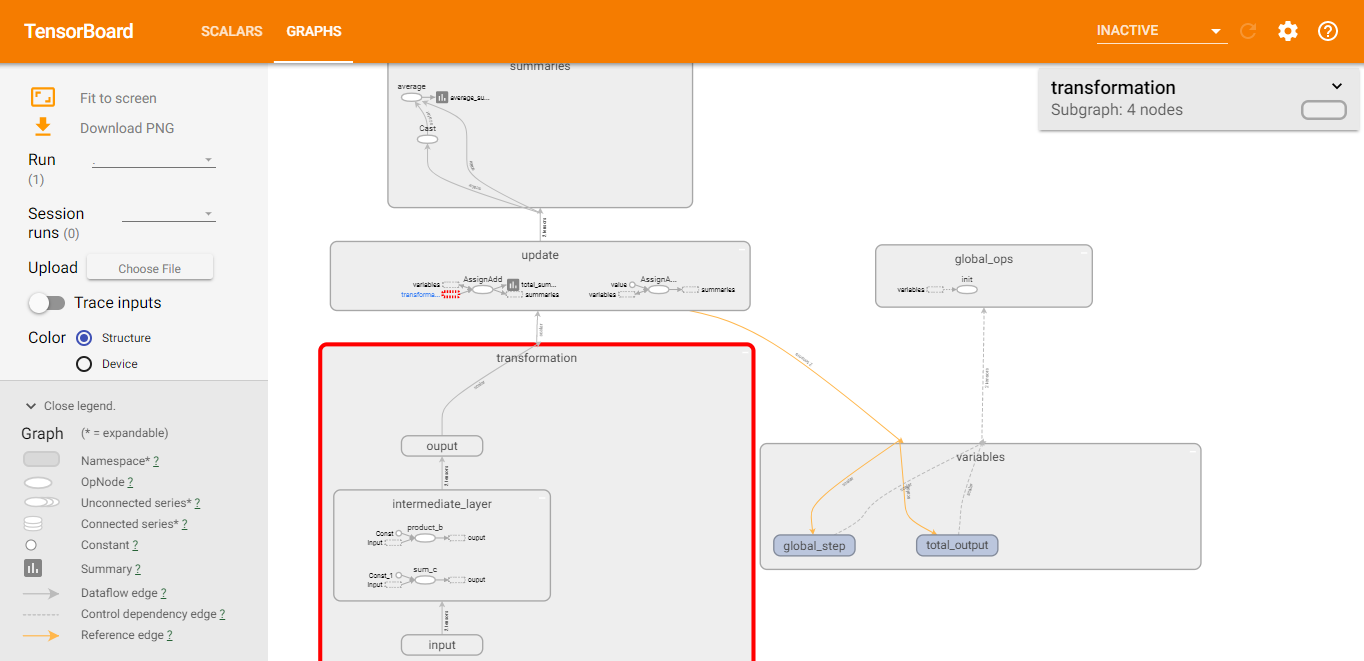
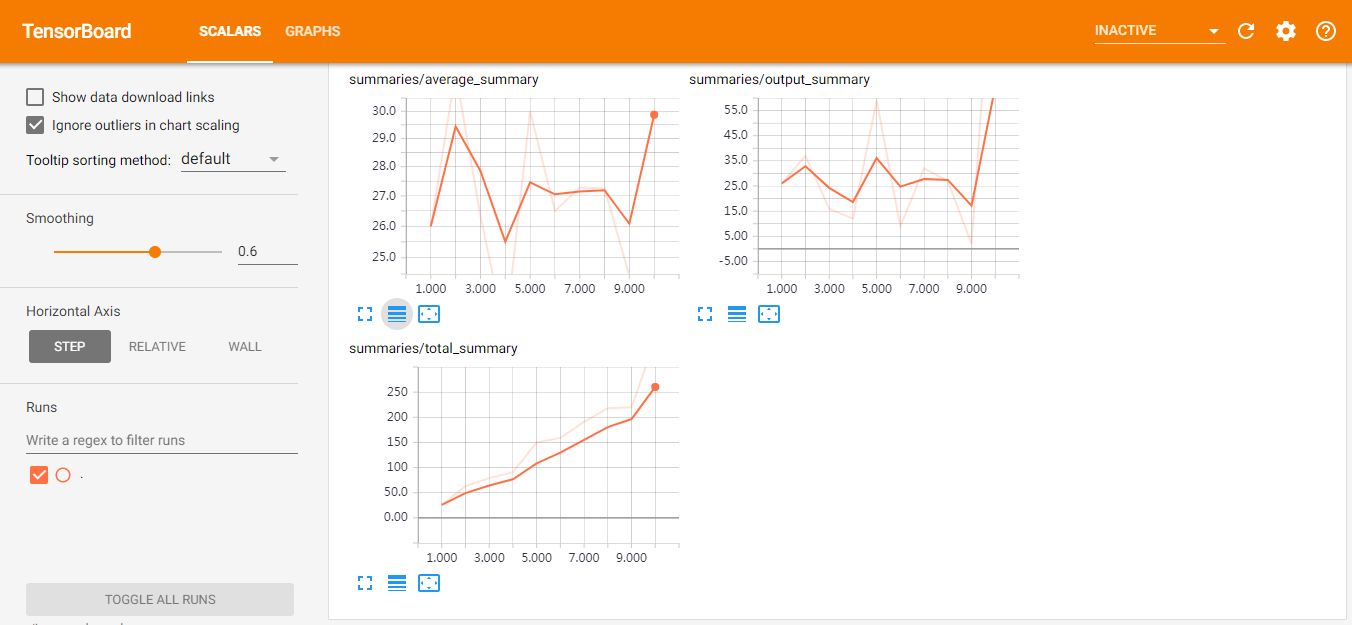
就可以看到如下界面:
这个是生成张量的折线图,代码里面有写
这个是计算图,很好玩,根据你代码里面定义的作用域名和张量名会写在里面,双击可以放大和还原,放大后滚动鼠标还可以选择继续放大,很好玩。里面的细节也可以继续双击打开来