hough变换思想就是将笛卡尔坐标系下的边缘坐标转换到极坐标系,进而将直线段检测转换成对应极坐标点的统计过程。
opencv提供了两种检测方法:
第一种为最初始方法,对应于opencv中的HoughLines接口:
import cv2 as cv
import numpy as np
import matplotlib.pyplot as plt
img = cv.imread('suduku.jpg')
gray = cv.cvtColor(img, cv.COLOR_BGR2GRAY)
edges = cv.Canny(gray, 50, 150, apertureSize = 3)
lines = cv.HoughLines(edges, 1, np.pi/180, 200)
for line in lines:
rho, theta = line[0]
a = np.cos(theta)
b = np.sin(theta)
x0 = a * rho
y0 = b * rho
x1 = int(x0 + 1000 * (-b))
y1 = int(x0 + 1000 * (a))
x2 = int(x0 - 1000 * (-b))
y2 = int(x0 - 1000 * (a))
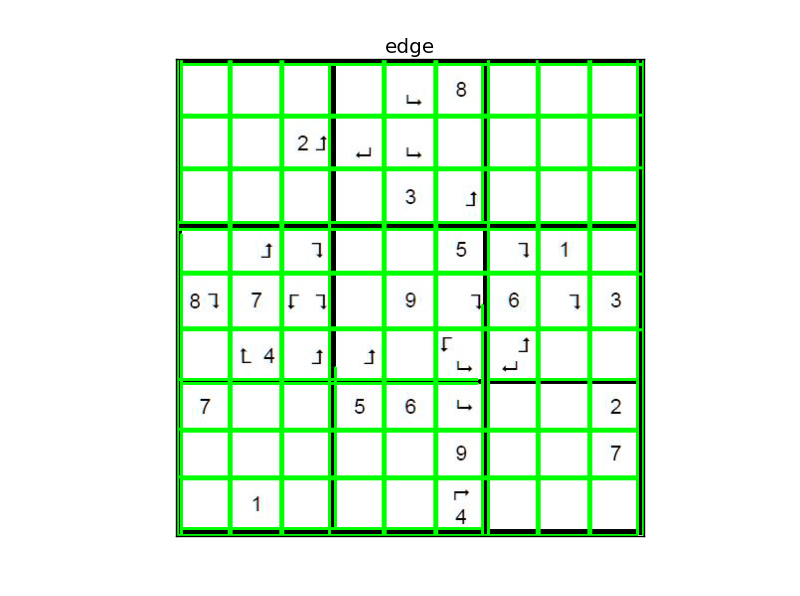
cv.line(img, (x1, y1), (x2, y2), (0, 0, 255), 2)效果如下:
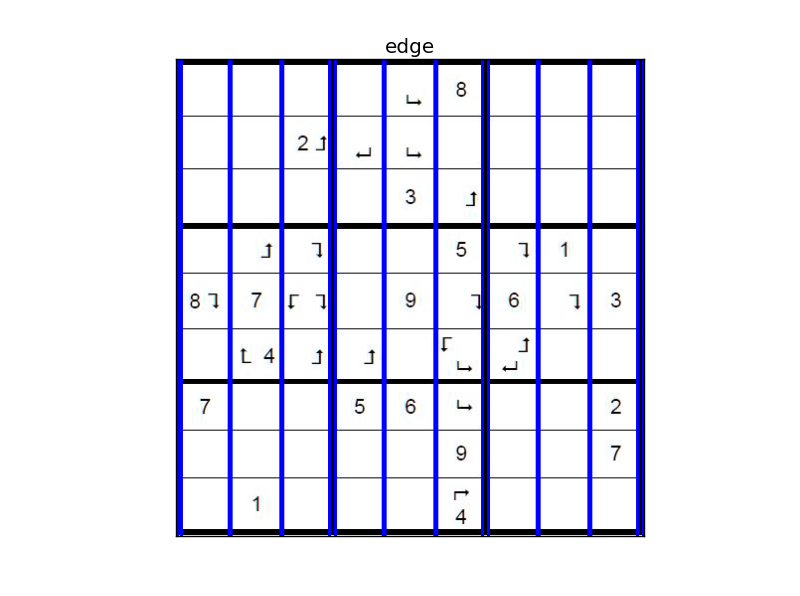
第二种为概率Hough变换,对应于opencv的HoughLinesP接口:
import cv2 as cv
import numpy as np
import matplotlib.pyplot as plt

img = cv.imread('suduku.jpg')
gray = cv.cvtColor(img, cv.COLOR_BGR2GRAY)
edges = cv.Canny(gray,50,150,apertureSize = 3)
lines = cv.HoughLinesP(edges,1,np.pi/180,100,minLineLength=100,maxLineGap=10)
for line in lines:
    x1,y1,x2,y2 = line[0]
    cv.line(img,(x1,y1),(x2,y2),(0,255,0),2)

plt.subplot(111), plt.imshow(img)
plt.title('edge'), plt.xticks([]), plt.yticks([])
plt.show()
效果如下: