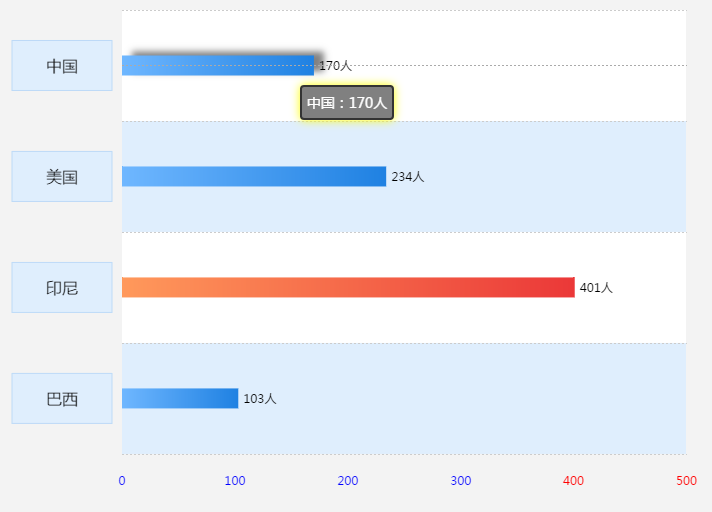
1、示例图
2、源码
var warningcolorValue=400;//根据预警值变化柱子的颜色,值设置
option = {
    tooltip: {
            trigger: 'axis',
            formatter: '{b}:{c}人',//悬停显示数据单位
            backgroundColor:'gray',
            borderWidth: 2,
            extraCssText: 'box-shadow: 0 0 13px yellow;',
            axisPointer: {
                type: 'line',
                lineStyle:{
                   type:'dotted',
                }
            }
    },
    grid: [{
        top: 50,
        width: '50%',
        bottom: '45%',
        left: 400,
        containLabel: false,
        // backgroundColor: 'red',
    },],
    xAxis: [{
        type: 'value',
        axisLine: {show: false},
        splitLine: {show: false},
        axisTick: {show: false},
        offset: 10,
        axisLabel: {
            margin:10,
            textStyle: {
            color: function (value) {//x轴颜色的设定
                 return value >= warningcolorValue ? 'red' : 'blue';//横坐标预警值
            },
        }
    }
    }],
    yAxis: [{
        type: 'category',
        data: ['巴西','印尼','美国','中国'],
        splitLine: {
            show: true,
            lineStyle:{
                width:1,
                type:'dotted',
            }
        },
        axisTick: {show: false},
        axisLine: {show: false},
        axisLabel: {
            formatter: function (value) {
                return '{value|' + value + '}';
            },
            margin: 10,
            rich: {
                value: {
                    height: 50,
                    align: 'center',
                    backgroundColor: '#dfeefd',
                    width:100,
                    color: '#000',
                    fontSize: 16,
                    borderWidth:1,
                    borderColor:'#bddaf7',
                },
            }
        },
        splitArea : {
					show : true,
					areaStyle : {
						color : [ '#dfeefd', '#fff', ]
					}
				},
    }],
    series: [{
        type: 'bar',
        barWidth:20,
        itemStyle : {
                  color: function (params){
                        if(params.data>warningcolorValue){//系列预警值,根据预警值变化柱子的颜色
                            var warningColor= new echarts.graphic.LinearGradient( 0, 0, 1, 0,[{offset: 0, color: '#ff995b'},{offset: 1, color: '#eb3838'}]);
                            return warningColor;
                        }
                        else{
                            var normalColor= new echarts.graphic.LinearGradient( 0, 0, 1, 0,[{offset: 0, color: '#6fb7ff'},{offset: 1, color: '#1f81e2'}]);
                            return normalColor;
                        }
                    },

        },
        emphasis: {
            itemStyle : {
                shadowColor: 'gray',
                shadowBlur: 10,
                shadowOffsetX:10,
                shadowOffsetY:-4,
            }
        },
        label: {
                position: 'right',//标签数据显示的位置
                show: true,
                formatter: '{c}人'//加单位
        },
        data: [103, 401, 234, 170],
    }]

}