1、编写前端显示页面
<html lang="zh-CN">
<head>
    <meta http-equiv="Content-Type" content="text/html; charset=UTF-8">
    <title>ECharts</title>

    <!-- 引入 echarts.js -->
    <script type="text/javascript" src="echarts.min.js"></script>
    <!-- 引入jquery.js -->
    <script type="text/javascript" src="jquery-1.12.3.js"></script>
</head>

<body>
    <!-- 为ECharts准备一个具备大小(宽高)的Dom -->
    <div id="main" style="width: 600px;height:400px;"></div>

    <script type="text/javascript">

        var myChart = echarts.init(document.getElementById('main'));
         // 显示标题,图例和空的坐标轴
         myChart.setOption({
             title: {
                 text: '异步数据加载示例'
             },
             tooltip: {},
             legend: {
                 data:['销量']
             },
             xAxis: {
                 data: []
             },
             yAxis: {},
             series: [{
                 name: '销量',
                 type: 'bar',
                 data: []
             }]
         });

         myChart.showLoading();    //数据加载完之前先显示一段简单的loading动画


      // 异步加载数据
         $.get('TestServlet2').done(function(data) {
             //alert(data.nums);//可用来查看数据是否由servlet传过来了
             myChart.hideLoading();
             // 填入数据
             myChart.setOption({
                 xAxis: {
                     data: data.categories
                 },
                 series: [{
                     // 根据名字对应到相应的系列
                     name: '销量',
                     data: data.data
                 }]
             });
         });


    </script>

</body>
</html> 直接套用echarts官网的异步加载数据样例即可,这里需要引入echarts.min.js和jquery-1.12.3.js,将两个js文件放在html页面同目录下,因为涉及到echarts图表显示和ajax异步加载数据。异步加载时$.get('TestServlet2')中的TestServlet2即是响应图表数据请求的servlet,直接写web.xml中配置的连接即可,不需要加上项目名称,与在网页中访问servlet不同。所有这些东西都挺简单,但是由于我不会使用java,所以还是折腾了段时间。
2、编写前端数据请求的servlet响应
package com.runoob.test;

import java.io.IOException;
import javax.servlet.ServletException;
import javax.servlet.http.HttpServlet;
import javax.servlet.http.HttpServletRequest;
import javax.servlet.http.HttpServletResponse;
import com.alibaba.fastjson.JSONObject;

public class TestServlet2 extends HttpServlet {

    @Override
    protected void doGet(HttpServletRequest req, HttpServletResponse resp) throws ServletException, IOException {
        doPost(req,resp);
    }

    @Override
    protected void doPost(HttpServletRequest request, HttpServletResponse response) throws ServletException, IOException {

        JSONObject json = new JSONObject();
        json.put("categories", new String[] {"衬衫","羊毛衫","雪纺衫","裤子","高跟鞋","袜子"});
        json.put("data", new int[] {5, 20, 36, 10, 10, 20});


        //将json数据返回给客户端
        response.setContentType("application/json; charset=utf-8");
        response.getWriter().write(json.toJSONString());
    }
}在servlet响应里直接生成了一个新的josn数据,将返回给客户端,注意response.setContentType("application/json; charset=utf-8")。
配置好web项目的web.xml后即访问http://localhost:8080/echartTest/hello.html,得到如下的显示页面

2、从mysql数据库读取数据转换为josn格式后传递给前端
20、Echarts前端后台的贯通写法
来源
还未运行,先记录在这里,有时间再来看。
注:以下所有内容建立在FH admin开源框架和eharts插件基础上,建议观看本案例者进行了解。
20.1、业务逻辑
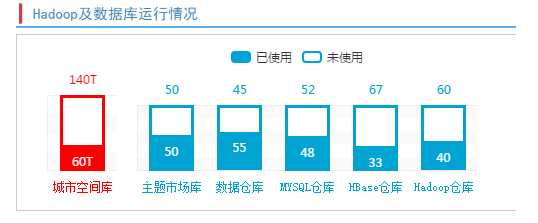
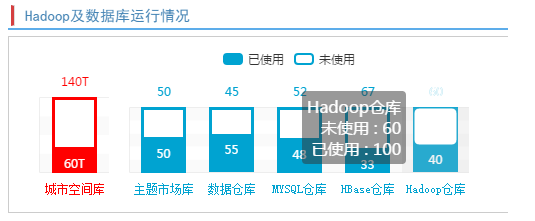
绘制两张图表,分别显示城市空间库和其他数据仓库的信息(城市空间库单独绘制)。要求:城市空间库显示数据库的实际使用量和剩余用量,其他库显示百分比。
20.2、效果展示
默认显示状态
鼠标指向状态
20.3、实现过程
1.后台数据处理
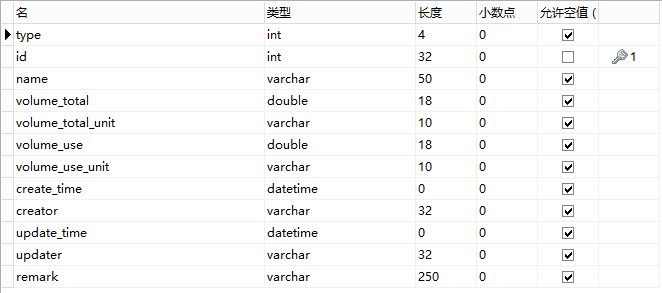
表结构设计
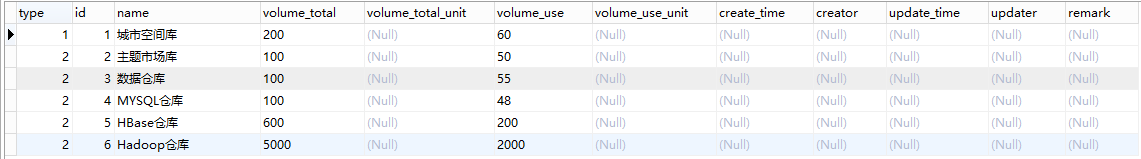
数据库数据
注:此处数据为显示数据,并非项目使用数据,仅作测试使用。
Mapper文件写法
注1:此处在前端页面需要绘制两个图表,因此用两条sql语句,区别为提供查询的type字段不同,此字段也可由传参带入,使用一条sql分别实现查询,此次为了展示直观,采用第一种做法。
注2:由于采用框架,此处数据为采用实体类封装,而是采用HashMap封装。可以根据自己习惯,创建实体类来存储数据库中数据。
<?xml version="1.0" encoding="UTF-8"?>
<!DOCTYPE mapper PUBLIC "-//mybatis.org//DTD Mapper 3.0//EN" "http://mybatis.org/dtd/mybatis-3-mapper.dtd">
<mapper namespace="SjkyxMapper">

    <!-- 列表(无实际意义,为以后扩展功能用) -->
    <select id="datalist" parameterType="page" resultType="pd">
        SELECT
            a.id,
            a.dept,
            a.order,
            a.score
         FROM
             cms_yw_fwxl AS a
         ORDER BY
              a.order
    </select>


    <!-- 获取城市空间库的信息 -->
    <select id="getcskjcharts" parameterType="page" resultType="pd">
        SELECT
            c.type,
            c.id,
            c.`name`,
            c.volume_total,
            c.volume_total_unit,
            c.volume_use,
            c.volume_use_unit,
            c.create_time,
            c.creator,
            c.update_time,
            c.updater,
            c.remark
         FROM
            cms_yw_sjkyx AS c
         WHERE
             type = 1
    </select>


    <!-- 获取其他库的信息 -->
    <select id="getothercharts" parameterType="page" resultType="pd">
        SELECT
            c.type,
            c.id,
            c.`name`,
            c.volume_total,
            c.volume_total_unit,
            c.volume_use,
            c.volume_use_unit,
            c.create_time,
            c.creator,
            c.update_time,
            c.updater,
            c.remark
         FROM
            cms_yw_sjkyx AS c
         WHERE
             type = 2
    </select>

</mapper>
Service中写法
注1:此处采用的已有框架,使用已经提供的统一的Dao,如果使用传统的SSM写法,可以自己稍加修改,在此不做赘述。
注2:根据业务逻辑理解代码,其中封装了createData方法来实现不同的业务逻辑
@Service("sjkyxService")
public class SjkyxService {

    @Resource(name = "daoSupport")
    private DaoSupport dao;

    /*
    *数据资源列表
    */
    public List<PageData> list(Page page)throws Exception{
        return (List<PageData>)dao.findForList("SjkyxMapper.datalist", page);
    }


    /*
     * 用来返回城市空间库使用信息
     */
    public Map<String, Object> getcskjcharts(int type)throws Exception{
        List<PageData> list = (List<PageData>)dao.findForList("SjkyxMapper.getcskjcharts", null);
        return createData(list,type);
    }

    /*
     * 用来返回其他库所用信息
     */
    public Map<String, Object> getothercharts(int type)throws Exception{
        List<PageData> list = (List<PageData>)dao.findForList("SjkyxMapper.getothercharts", null);
        return createData(list,type);
    }

    /*
     * 内部设计的方法,用于封装查询数据
     */
    private Map<String, Object> createData(List<PageData> list,int type)throws Exception{
        Map<String,Object> resultMap = new HashMap<String,Object>();
        //x轴现实的信息
        String[] xAxisArr = new String[list.size()];
        //总量信息
        Integer[] restArr = new Integer[list.size()];
        //已使用信息
        Integer[] usedArr = new Integer[list.size()];
        if(1==type){
            for(int i=0;i<list.size();i++){
                xAxisArr[i] =(String) list.get(i).get("name");
                usedArr[i] = Integer.parseInt(new java.text.DecimalFormat("0").format((Double) list.get(i).get("volume_use")));
                double restData = (Double)list.get(i).get("volume_total")-(Double) list.get(i).get("volume_use");
                restArr[i] = Integer.parseInt(new java.text.DecimalFormat("0").format(restData));
            }
        }else if(2==type){
            for(int i=0;i<list.size();i++){
                xAxisArr[i] =(String) list.get(i).get("name");
                double perData = (Double) list.get(i).get("volume_use")/(Double) list.get(i).get("volume_total")*100;
                usedArr[i] = Integer.parseInt(new java.text.DecimalFormat("0").format(perData));
                double restData = ((Double)list.get(i).get("volume_total")-(Double) list.get(i).get("volume_use"))/(Double) list.get(i).get("volume_total")*100;
                restArr[i] = Integer.parseInt(new java.text.DecimalFormat("0").format(restData));
            }
        }
        resultMap.put("xAxisArr", xAxisArr);
        resultMap.put("restArr", restArr);
        resultMap.put("usedArr", usedArr);
        return resultMap;
    }
}
Controller中写法
主要用于跳转页面和Ajax传递数据,涉及权限管理的部分可以不用看。
package com.bonc.dgioc.portal.web.controller.portal.operate;

import java.text.DateFormat;
import java.text.SimpleDateFormat;
import java.util.Date;
import java.util.HashMap;
import java.util.List;
import java.util.Map;

import javax.annotation.Resource;

import org.apache.shiro.SecurityUtils;
import org.apache.shiro.session.Session;
import org.apache.shiro.subject.Subject;
import org.springframework.beans.propertyeditors.CustomDateEditor;
import org.springframework.stereotype.Controller;
import org.springframework.web.bind.WebDataBinder;
import org.springframework.web.bind.annotation.InitBinder;
import org.springframework.web.bind.annotation.RequestMapping;
import org.springframework.web.bind.annotation.ResponseBody;
import org.springframework.web.servlet.ModelAndView;

import com.bonc.dgioc.portal.common.utils.Const;
import com.bonc.dgioc.portal.common.utils.PageData;
import com.bonc.dgioc.portal.domain.entity.Page;
import com.bonc.dgioc.portal.service.portal.operate.FwxlService;
import com.bonc.dgioc.portal.service.portal.operate.SjkyxService;
import com.bonc.dgioc.portal.service.portal.operate.SjzyService;
import com.bonc.dgioc.portal.web.controller.base.BaseController;


/**
 * 功    能:运维首页数据库运行情况
 * 类名称:SjkyxController
 * 创建人:@author Xiaoqi
 * 创建时间:2016-03-29
 */

@Controller
@RequestMapping(value="/operate/sjkyx")
public class SjkyxController extends BaseController {

    @Resource(name="sjkyxService")
    private SjkyxService sjkyxService;


    /**
     * 获取sjkyx列表
     * @author Xiaoqi
     * @date 2016-03-30
     */
    @RequestMapping(value="/getsjkyxlist")
    public ModelAndView list(Page page){
        logBefore(logger, "列表sjkyx信息");
        ModelAndView mv = this.getModelAndView();
        PageData pd = new PageData();
        try{
            pd = this.getPageData();
            page.setPd(pd);
            List<PageData>  varList = sjkyxService.list(page);  //列出sjkyx列表
            mv.setViewName("portal/operate/sjkyx_list");
            mv.addObject("varList", varList);
            mv.addObject("pd", pd);
            mv.addObject(Const.SESSION_QX,this.getHC());    //按钮权限
        } catch(Exception e){
            logger.error(e.toString(), e);
        }
        return mv;
    }


    /**
     * 返回城市空间库的图表信息
     * @return 返回城市空间库的图表信息
     * @date 2016-04-11
     */
    @ResponseBody
    @RequestMapping(value="/getcskjcharts")
    public Map<String,Object> getcskjcharts(){
        logBefore(logger, "获取城市空间库图表信息");
        Map<String,Object> resultMap = new HashMap<String,Object>();
        try{
            resultMap = sjkyxService.getcskjcharts(1);  //获取其他库图表信息
        } catch(Exception e){
            logger.error(e.toString(), e);
        }
        return resultMap;
    }

    /**
     * 返回城市空间库之外的其他库的图表信息
     * @return 返回城市空间库之外的其他库的图表信息
     * @date 2016-04-11
     */
    @ResponseBody
    @RequestMapping(value="/getothercharts")
    public Map<String,Object> getothercharts(){
        logBefore(logger, "获取其他库图表信息");
        Map<String,Object> data = new HashMap<String,Object>();
        try{
            data = sjkyxService.getothercharts(2);  //获取其他库图表信息
        } catch(Exception e){
            logger.error(e.toString(), e);
        }
        return data;
    }


    /* ===============================权限================================== */
    public Map<String, String> getHC(){
        Subject currentUser = SecurityUtils.getSubject();  //shiro管理的session
        Session session = currentUser.getSession();
        return (Map<String, String>)session.getAttribute(Const.SESSION_QX);
    }
    /* ===============================权限================================== */

    @InitBinder
    public void initBinder(WebDataBinder binder){
        DateFormat format = new SimpleDateFormat("yyyy-MM-dd");
        binder.registerCustomEditor(Date.class, new CustomDateEditor(format,true));
    }


}
2.前端页面处理
以下为分部代码解读,最下方有前端页面全部代码。
引入echarts和jQuery文件
注:此处bootstrap为前端框架,此处知道其中含有jQuery文件即可。
<!-- 引入 -->
    <%@ include file="../../common/bootstrap_js.jsp"%>
    <script type="text/javascript" src="<%=basePath%>/resources/module/echarts/echarts.js"></script><!-- 引入echarts -->
建立div存放不同的图表
注:echarts中一个div只能绘制一张图表
<div>
     <div id="chkj" style="height:160px;width:20%;text-align:right;float:left;">
     </div>
     <div id="other" style="height:160px;width:80%;text-align:right;float:right;">
     </div>
</div>
echarts代码解读
引入echarts的主题和各种组件,调用绘制图表的方法drawotherCharts和drawchkjCharts
require.config({
    paths:{
         echarts:'<%=basePath%>/resources/module/echarts'
     }
});

require(
    ['echarts',
     'echarts/theme/macarons',
     'echarts/chart/line',    //使用折线图,就需要加载line模块,按需加载(柱图:bar;饼图:pie;地图:map;)
     'echarts/chart/bar',
     'echarts/chart/pie'
    ],
    function (ec,theme) {
        drawotherCharts(ec,theme),
        drawchkjCharts(ec,theme)
    }
);
绘制图表:
function drawotherCharts(ec,theme){
             var myChart = ec.init(document.getElementById("other"),theme);
             option = {
                    tooltip : {
                        trigger: 'axis',
                        axisPointer : {            // 坐标轴指示器,坐标轴触发有效
                            type : 'shadow'        // 默认为直线,可选为:'line' | 'shadow'
                        },
                        formatter: function (params){   //用来编辑鼠标指向时的文字信息
                            return params[0].name + '<br/>'
                                   + params[0].seriesName + ' : ' + params[0].value + '<br/>'
                                   + params[1].seriesName + ' : ' + (params[1].value + params[0].value);
                        }
                    },
                    legend: {   //此处为图例
                        selectedMode:false,
                        data:['已使用', '未使用']
                    },
                    grid:{     //此处控制图表在div中的位置

                            x:20,
                            y:60,
                            x2:0,
                            y2:35
                    },
                    toolbox: {  //此处为控制图表的工具栏,设置show选项为false,可以将show的false改为true来查看效果。
                        show : false,
                        feature : {
                            mark : {show: true},
                            dataView : {show: true, readOnly: false},
                            restore : {show: true},
                            saveAsImage : {show: true}
                        }
                    },
                    calculable : false,  //取消载入时的动态效果
                    xAxis : [  //x轴现实信息配置
                        {
                            type : 'category',
                            data : [],
                            splitLine:{
                                 show:false
                               },
                            axisTick:false,
                            axisLine:false,
                            axisLabel:{
                                 rotate:0,
                                 margin:10,
                                 textStyle:{
                                     fontSize : '2px',
                                     fontFamily : '微软雅黑',
                                     color: '#00A3D1'
                                 }
                             },
                        }
                    ],
                    yAxis : [    //y轴数据配置
                        {
                            type : 'value',
                            axisLine:false,
                            splitLine:{
                                      show:false
                               },
                            axisTick:false,
                            boundaryGap: [0, 0.1],
                            axisLabel:{
                                 show:false
                            }
                        }
                    ],
                    series : [
                        {
                            name:'已使用',
                            type:'bar',
                            stack: 'sum',
                            barCategoryGap: '50%',
                            barWidth:45,
                            itemStyle: {
                                normal: {
                                    color: '#00A3D1',
                                    barBorderColor: '#00A3D1',
                                    barBorderWidth: 4,
                                    barBorderRadius:0,
                                    label : {
                                        show: true, position: 'insideTop'
                                    }
                                }
                            },
                            data:[]
                        },
                        {
                            name:'未使用',
                            type:'bar',
                            stack: 'sum',
                            itemStyle: {
                                normal: {
                                    color: '#fff',
                                    barBorderColor: '#00A3D1',
                                    barBorderWidth: 3,
                                    barBorderRadius:0,
                                    label : {
                                        show: true,
                                        position: 'top',
                                        textStyle: {
                                            fontSize : '10',
                                            fontFamily : '微软雅黑',
                                            color: '#00A3D1'
                                        }
                                    }
                                }
                            },
                            data:[]
                        }
                    ]
                };

            myChart.showLoading({
                text: "图表数据正在努力加载..."
            });
            //通过ajax向后台发送请求,传递数据。
            $.ajax({
                type: 'GET',
                url : '<%=path %>/operate/sjkyx/getothercharts',
                dataType: 'json',
                success:function(data){
                    debugger;
                    option.xAxis[0]['data']=data.xAxisArr;
                    option.series[0]['data']=data.usedArr;
                    option.series[1]['data']=data.restArr;
                    myChart.setOption(option);
                },
                error:function(){
                    debugger;
                },
                complete:function(){
                    //不管数据接口成功或异常,都终于载入提示
                    myChart.hideLoading();//停止动画载入提示
                }
            })

        }
echarts完整代码
<%@ page language="java" contentType="text/html; charset=UTF-8" pageEncoding="UTF-8"%>
<%@ taglib prefix="c" uri="http://java.sun.com/jsp/jstl/core"%>
<%@ taglib prefix="fmt" uri="http://java.sun.com/jsp/jstl/fmt"%>
<%@ taglib prefix="fn" uri="http://java.sun.com/jsp/jstl/functions" %>
<%
String path = request.getContextPath();
String basePath = request.getScheme()+"://"+request.getServerName()+":"+request.getServerPort()+path+"/";
%>
<!DOCTYPE html>
<html lang="en">
<head>
<meta charset="utf-8" />
<title>Widgets - Ace Admin</title>
<base href="<%=basePath%>">
<!-- 引入 -->
<%@ include file="../../common/bootstrap_js.jsp"%>
<script type="text/javascript" src="<%=basePath%>/resources/module/echarts/echarts.js"></script><!-- 引入echarts -->
<script type="text/javascript">
require.config({
paths:{
echarts:'<%=basePath%>/resources/module/echarts'
}
});
require(
['echarts',
'echarts/theme/macarons',
'echarts/chart/line', //使用折线图,就需要加载line模块,按需加载(柱图:bar;饼图:pie;地图:map;)
'echarts/chart/bar',
'echarts/chart/pie'
],
function (ec,theme) {
drawotherCharts(ec,theme),
drawchkjCharts(ec,theme)
});
function drawotherCharts(ec,theme){
var myChart = ec.init(document.getElementById("other"),theme);
option = {
tooltip : {
trigger: 'axis',
axisPointer : { // 坐标轴指示器,坐标轴触发有效
type : 'shadow' // 默认为直线,可选为:'line' | 'shadow'
},
formatter: function (params){ //用来编辑鼠标指向时的文字信息
return params[0].name + '<br/>'
+ params[0].seriesName + ' : ' + params[0].value + '<br/>'
+ params[1].seriesName + ' : ' + (params[1].value + params[0].value);
}
},
legend: { //此处为图例
selectedMode:false,
data:['已使用', '未使用']
},
grid:{ //此处控制图表在div中的位置
x:20,
y:60,
x2:0,
y2:35
},
toolbox: { //此处为控制图表的工具栏,设置show选项为false,可以将show的false改为true来查看效果。
show : false,
feature : {
mark : {show: true},
dataView : {show: true, readOnly: false},
restore : {show: true},
saveAsImage : {show: true}
}
},
calculable : false, //取消载入时的动态效果
xAxis : [ //x轴现实信息配置
{
type : 'category',
data : [],
splitLine:{
show:false
},
axisTick:false,
axisLine:false,
axisLabel:{
rotate:0,
margin:10,
textStyle:{
fontSize : '2px',
fontFamily : '微软雅黑',
color: '#00A3D1'
}
},
}
],
yAxis : [ //y轴数据配置
{
type : 'value',
axisLine:false,
splitLine:{
show:false
},
axisTick:false,
boundaryGap: [0, 0.1],
axisLabel:{
show:false
}
}
],
series : [
{
name:'已使用',
type:'bar',
stack: 'sum',
barCategoryGap: '50%',
barWidth:45,
itemStyle: {
normal: {
color: '#00A3D1',
barBorderColor: '#00A3D1',
barBorderWidth: 4,
barBorderRadius:0,
label : {
show: true, position: 'insideTop'
}
}
},
data:[]
},
{
name:'未使用',
type:'bar',
stack: 'sum',
itemStyle: {
normal: {
color: '#fff',
barBorderColor: '#00A3D1',
barBorderWidth: 3,
barBorderRadius:0,
label : {
show: true,
position: 'top',
textStyle: {
fontSize : '10',
fontFamily : '微软雅黑',
color: '#00A3D1'
}
}
}
},
data:[]
}
]
};
myChart.showLoading({
text: "图表数据正在努力加载..."
});
//通过ajax向后台发送请求,传递数据。
$.ajax({
type: 'GET',
url : '<%=path %>/operate/sjkyx/getothercharts',
dataType: 'json',
success:function(data){
debugger;
option.xAxis[0]['data']=data.xAxisArr;
option.series[0]['data']=data.usedArr;
option.series[1]['data']=data.restArr;
myChart.setOption(option);
},
error:function(){
debugger;
},
complete:function(){
//不管数据接口成功或异常,都终于载入提示
myChart.hideLoading();//停止动画载入提示
}
})
}
function drawchkjCharts(ec,theme){
var myChart = ec.init(document.getElementById("chkj"),theme);
options = {
tooltip : {
show:false,
trigger: 'axis',
axisPointer : { // 坐标轴指示器,坐标轴触发有效
type : 'shadow' // 默认为直线,可选为:'line' | 'shadow'
},
formatter: function (params){
return params[0].name + '<br/>'
+ params[0].seriesName + ' : ' + params[0].value + '<br/>'
+ params[1].seriesName + ' : ' + (params[1].value + params[0].value);
}
},
grid:{
x:20,
y:50,
x2:0,
y2:35
},
toolbox: {
show : false,
feature : {
mark : {show: true},
dataView : {show: true, readOnly: false},
restore : {show: true},
saveAsImage : {show: true}
}
},
calculable : false,
xAxis : [
{
type : 'category',
data : [],
splitLine:{
show:false
},
axisTick:false,
axisLine:false,
axisLabel:{
rotate:0,
margin:10,
textStyle:{
fontSize : '2px',
fontFamily : '微软雅黑',
color: 'red'
}
},
}
],
yAxis : [
{
type : 'value',
axisLine:false,
splitLine:{
show:false
},
axisTick:false,
boundaryGap: [0, 0.1],
axisLabel:{
show:false
}
}
],
series : [
{
name:'已使用',
type:'bar',
stack: 'sum',
barCategoryGap: '50%',
barWidth:45,
itemStyle: {
normal: {
color: 'red',
barBorderColor: 'red',
barBorderWidth: 4,
barBorderRadius:0,
label : {
show: true, position: 'insideTop',
formatter:'{c}'+'T'
}
}
},
data:[]
},
{
name:'未使用',
type:'bar',
stack: 'sum',
itemStyle: {
normal: {
color: '#fff',
barBorderColor: 'red',
barBorderWidth: 3,
barBorderRadius:0,
label : {
show: true,
position: 'top',
formatter:'{c}'+'T',
textStyle: {
fontSize : '10',
fontFamily : '微软雅黑',
color: 'red'
}
}
}
},
data:[]
}
]
};
myChart.showLoading({
text: "图表数据正在努力加载..."
});
$.ajax({
type: 'GET',
url : '<%=path %>/operate/sjkyx/getcskjcharts',
dataType: 'json',
success:function(data){
debugger;
options.xAxis[0]['data']=data.xAxisArr;
options.series[0]['data']=data.usedArr;
options.series[1]['data']=data.restArr;
myChart.setOption(options);
},
error:function(){
debugger;
},
complete:function(){
//不管数据接口成功或异常,都终于载入提示
myChart.hideLoading();//停止动画载入提示
}
})
}
</script>
</head>
<body style="height:160px;width:450px;text-align:left;">
<div>
<div id="chkj" style="height:160px;width:20%;text-align:right;float:left;">
</div>
<div id="other" style="height:160px;width:80%;text-align:right;float:right;">
</div>
</div>
</body>
</html>杂
js timer 实现网页自动刷新
javascript实现动态刷新网页的功能
java发起http请求获取返回的Json对象