使用pandas将数据进行导入作为训练集,通过matplot实现数据可视化。
目标:建立分类器(求解出参数)
设定阈值,根据阈值判断录取结果
需要完成的模块
-
sigmoid: 映射到概率的函数 -
model: 返回预测结果值 -
cost: 根据参数计算损失 -
gradient: 计算每个参数的梯度方向 -
descent: 进行参数更新 -
accuracy: 计算精度
sigmoid函数
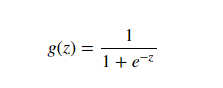
def sigmoid(x):
return 1 / (1 + np.exp(-x))
model
def model(X, theta):

    return sigmoid(np.dot(X, theta.T))
损失函数

def cost(X, y, theta):
    left = np.multiply(-y, np.log(model(X, theta)))
    right = np.multiply(1 - y, np.log(1 - model(X, theta)))
    return np.sum(left - right) / (len(X))
梯度计算
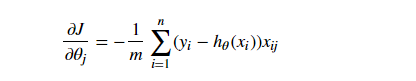
def gradient(X, y, theta):
    grad = np.zeros(theta.shape)
    error = (model(X, theta)- y).ravel()
    for j in range(len(theta.ravel())): #for each parmeter
        term = np.multiply(error, X[:,j])
        grad[0, j] = np.sum(term) / len(X)

    return grad