KITTI数据
KITTI的数据集有很多,我们在这里选取了其中的raw_data(原始数据)进行融合,数据下载地址:http://www.cvlibs.net/datasets/kitti/raw_data.php
KITTI数据集的数据采集平台装配有2个灰度摄像机,2个彩色摄像机,一个Velodyne 64线3D激光雷达,4个光学镜头,以及1个GPS导航系统。具体的传感器参数如下 :
- 2 × PointGray Flea2 grayscale cameras (FL2-14S3M-C), 1.4 Megapixels,
1/2” Sony ICX267 CCD, global shutter - 2 × PointGray Flea2 color cameras (FL2-14S3C-C), 1.4 Megapixels, 1/2”
Sony ICX267 CCD, global shutter - 4 × Edmund Optics lenses, 4mm, opening angle ∼ 90◦, vertical opening
angle of region of interest (ROI) ∼ 35◦ - 1 × Velodyne HDL-64E rotating 3D laser scanner, 10 Hz, 64 beams, 0.09
degree angular resolution, 2 cm distance accuracy, collecting ∼ 1.3
million points/second, field of view: 360◦ horizontal, 26.8◦
vertical, range: 120 m - 1 × OXTS RT3003 inertial and GPS navigation system, 6 axis, 100 Hz,
L1/L2 RTK, resolution: 0.02m / 0.1◦
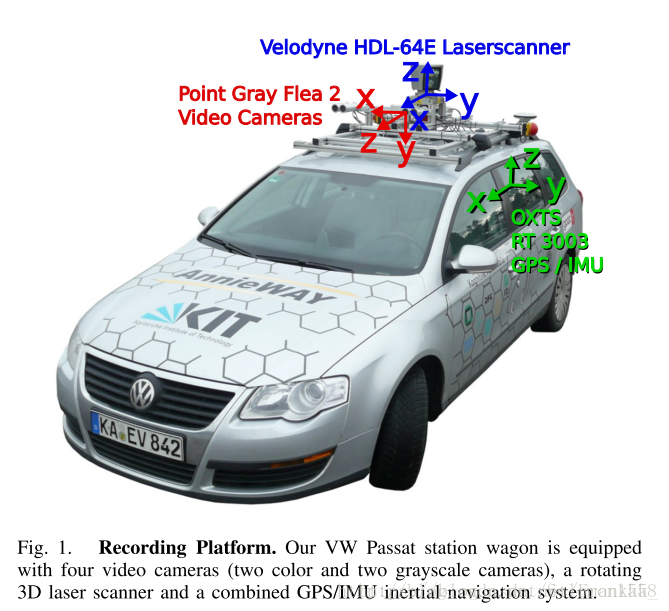
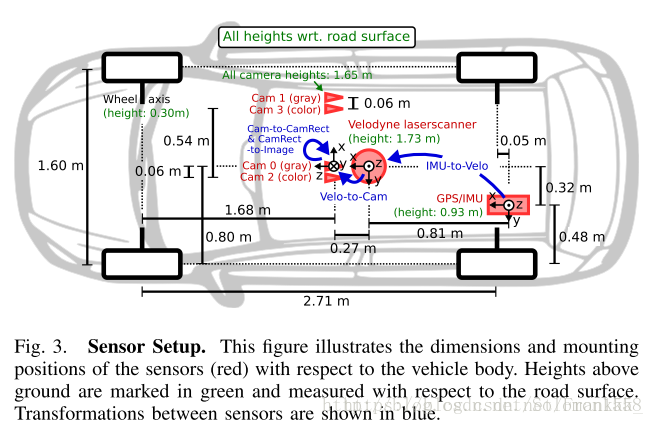
传感器的安装位置如下图:
对于我们使用的raw_data数据集,其数据包(以2011_09_26_drive_0001,synced,+rectified data为例),解压之后主要包含以下几个部分:
- 标定文件:calib_cam_to_cam.txt,calib_imu_to_velo.txt,calib_velo_to_cam.txt
- 摄像头文件:image_00到image_03四个文件夹,分别对应4个摄像头,常用的摄像头为02
- 点云文件:雷达扫描到的点文件,velodyne_points文件夹,其中包括多个bin文件和时间戳文件
代码实现
KITTI数据集提供了官方的toolkit来方便我们对数据集进行操作,对于其中的raw_data数据,提供了十多个函数来方便我们进行操作。并提供了数据融合的demo如下:
function run_demoVelodyne (base_dir,calib_dir)
% clear and close everything
close all; dbstop error; clc;
disp('======= KITTI DevKit Demo =======');
% 根据函数输入参数的不同的设定
if nargin<1
base_dir = './data/2011_09_26/2011_09_26_drive_0005_sync';
end
if nargin<2
calib_dir = './data/2011_09_26';
end
cam = 2; % 0-based index
frame = 137; % 0-based index
%加载标定文件,fullfile将路径和文件相结合
%calib是相机参数的结构矩阵
calib = loadCalibrationCamToCam(fullfile(calib_dir,'calib_cam_to_cam.txt'));
%Tr_velo_to_cam是一个参数矩阵
Tr_velo_to_cam = loadCalibrationRigid(fullfile(calib_dir,'calib_velo_to_cam.txt'));
%计算从雷达的3d数据到摄像机图片的投影矩阵
R_cam_to_rect = eye(4);
R_cam_to_rect(1:3,1:3) = calib.R_rect{1};
P_velo_to_img = calib.P_rect{cam+1}*R_cam_to_rect*Tr_velo_to_cam;
% load and display image
img = imread(sprintf('%s/image_%02d/data/%010d.png',base_dir,cam,frame));
fig = figure('Position',[20 100 size(img,2) size(img,1)]);
axes('Position',[0 0 1 1]);
imshow(img); hold on;
% load velodyne points
fid=fopen(sprintf('%s/velodyne_points/data/%010d.bin',base_dir,frame),'rb');%先以二进制方式打开
velo = fread(fid,[inf 4],'single');%将文件读取为single格式,维度为(n,4)
velo = velo(1:5:end,:);%每五个点只取一个点,为了方便显示
fclose(fid);
% remove all points behind image plane (approximation
idx = velo(:,1)<5; %找到x坐标小于5的雷达点的索引
velo(idx,:) = []; %将这些点去掉
% project to image plane (exclude luminance)
velo_img = project(velo(:,1:3),P_velo_to_img);
% plot points,彩色
cols = jet;
for i=1:size(velo_img,1)
col_idx = round(64*5/velo(i,1));
plot(velo_img(i,1),velo_img(i,2),'o','LineWidth',4,'MarkerSize',1,'Color',cols(col_idx,:));
end
% plot points,灰度图
% cols = 1-[0:1/63:1]'*ones(1,3);
% for i=1:size(velo_img,1)
% col_idx = round(64*5/velo(i,1));
% plot(velo_img(i,1),velo_img(i,2),'o','LineWidth',4,'MarkerSize',1,'Color',cols(col_idx,:));
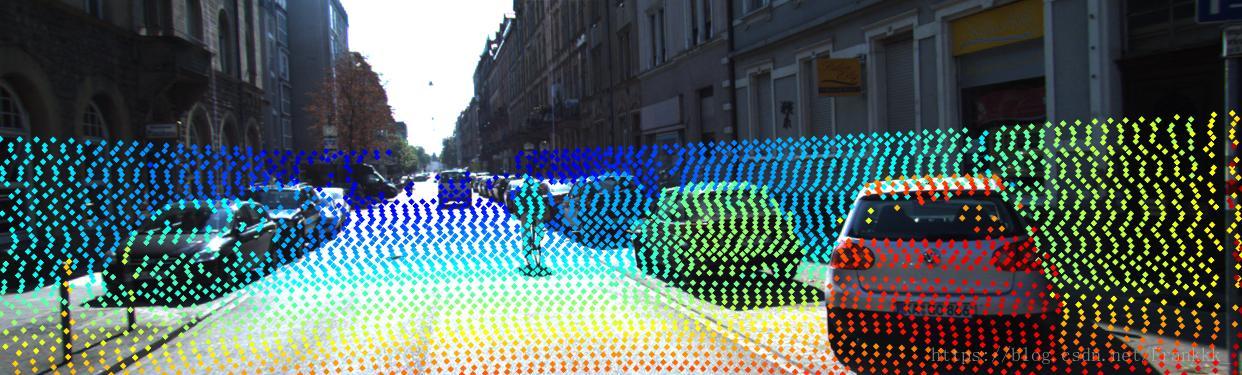
% end最后的效果图如下:
完整的toolkit和数据,代码可以到我的github下载:
https://github.com/Lannyy/DataFusion