import numpy as np
from matplotlib import pyplot as plt
vector = []
X_train = np.random.random((10,2))*10
X_train
array([[7.05645191, 2.03283782],
       [9.84088868, 9.2098794 ],
       [4.42267578, 6.25019533],
       [5.46755187, 9.08930389],
       [9.20171955, 9.04884687],
       [8.54263158, 3.78581056],
       [2.96090637, 8.95534109],
       [1.75050855, 6.18965679],
       [0.62478165, 0.36083049],
       [2.48284924, 1.33775375]])
y_train = np.array([0, 0, 0, 0, 0, 1, 1, 1, 1 ,1])
plt.scatter(X_train[y_train==0, 0], X_train[y_train==0, 1], color='g')
plt.scatter(X_train[y_train==1, 0], X_train[y_train==1, 1], color='r')
<matplotlib.collections.PathCollection at 0x7effc457a160>

返回索引
y_train == 0
array([ True,  True,  True,  True,  True, False, False, False, False,
       False])
X_train[y_train==0, 1]
array([2.03283782, 9.2098794 , 6.25019533, 9.08930389, 9.04884687])
当新来一个数据的时候,我们要对其利用knn来进行预测
x = np.array([8.093607318, 3.36573154])
对这个数据点用蓝色来进行绘制
plt.scatter(X_train[y_train==0, 0], X_train[y_train==0, 1], color='g')
plt.scatter(X_train[y_train==1, 0], X_train[y_train==1, 1], color='r')
plt.scatter(x[0], x[1], color='b')
<matplotlib.collections.PathCollection at 0x7effc43f1710>
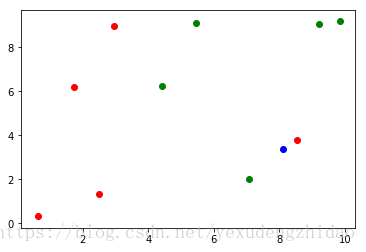
利用knn算法我来预测这个蓝色的数据点应该属于红色还是绿色呢?
distances = []
for x_train in X_train:
    d = np.sqrt(np.sum((x_train - x)**2))
    distances.append(d)
distances
[1.6888744774658548,
 6.099758713306036,
 4.668604690613447,
 6.297257152825911,
 5.79013925598309,
 0.6148895598638827,
 7.588699092645479,
 6.943302943316977,
 8.050638930020376,
 5.966012075443629]
下面是测试笔记
np.array([2,3])**2
array([4, 9])
np.sum(np.array([2,3])**2)
13
对得到的欧拉距离进行排序,返回索引。
nearest = np.argsort(distances)
nearest
array([5, 0, 2, 4, 9, 1, 3, 7, 6, 8])
假如k=3
k=6
first_k = [y_train[i] for i in nearest[:k]]
first_k
[1, 0, 0, 0, 1, 0]
from collections import Counter
vote = Counter(first_k)
vote
Counter({1: 2, 0: 4})
vote.most_common(1)
[(0, 4)]
predict_y = vote.most_common(1)[0][0]
predict_y
0