直方图概念是基于图像像素值,其实对图像梯度、每个像素的角度、等一切图像的属性值,我们都可以建立直方图。
    这个才是直方图的概念真正意义,不过是基于图像像素灰度直方图是最常见的。
直方图最常见的几个属性:
 - dims 表示维度,对灰度图像来说只有一个通道值dims=1
 - bins 表示在维度中子区域大小划分,如bins=256,划分为256个级别   x轴
 - range 表示值的范围,灰度值范围为[0~255]之间   y轴

split(// 把多通道图像分为多个单通道图像
    const Mat &src, //输入图像
    Mat* mvbegin // 输出的通道图像数组
)

calcHist(// 计算直方图
    const Mat* images,//输入图像指针
    int images,// 图像数目
    const int* channels,// 要计算的通道数的下标,可以传一个数组 {0, 1} 表示计算第0通道与第1通道的直方图,此数组长度要与histsize ranges 数组长度一致
    InputArray mask,// 输入mask,可选,不用
    OutputArray hist,//输出的直方图数据
    int dims,// 维数
    const int* histsize,// 直方图级数, 对应 bins
    const float** ranges,// 值域范围
    bool uniform,// true by default
    bool accumulate// false by defaut 多通道时true?
)
代码
#include "../common/common.hpp"
void main(int argc, char** argv)
{
Mat src;
src = imread(getCVImagesPath("images/test1_3.png"), IMREAD_COLOR);
// 把多通道图像分为多个单通道图像
vector<Mat> bgr_planes;
split(src, bgr_planes);// 把多通道图像分为多个单通道图像
printf("channels=%d\n", bgr_planes.size());//3通道,所以size也是3
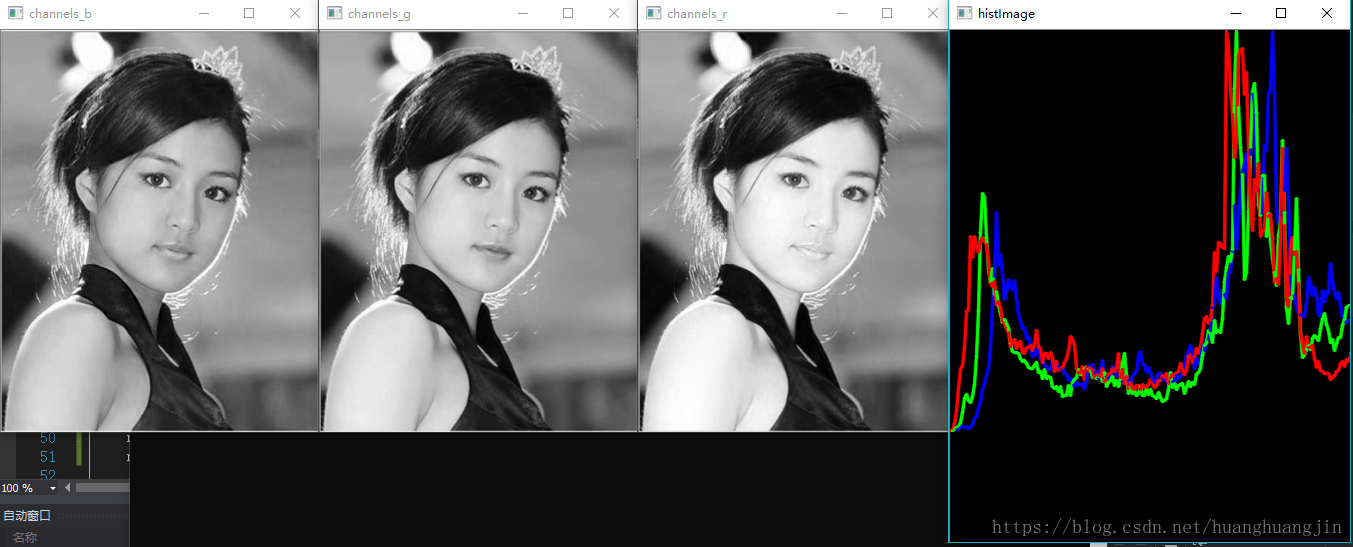
imshow("channels_b", bgr_planes[0]);
imshow("channels_g", bgr_planes[1]);
imshow("channels_r", bgr_planes[2]);
//计算直方图
int histBins = 256;
float range[] = { 0, 256 };
const float * histRanges = range;//函数形参 float ** 与 const float ** 是两种不同数据类型。。
Mat b_hist, g_hist, r_hist;//calcHist计算出来的Mat中元素的最大值可能上几千,所以最好归一化后再绘制直方图
calcHist(&bgr_planes[0], 1, 0, Mat(), b_hist, 1, &histBins, &histRanges, true, false);//计算直方图
calcHist(&bgr_planes[1], 1, 0, Mat(), g_hist, 1, &histBins, &histRanges, true, false);
calcHist(&bgr_planes[2], 1, 0, Mat(), r_hist, 1, &histBins, &histRanges, true, false);
//归一化
int hist_cols = 400;
int hist_rows = 512;
int bin_w = hist_rows / histBins;
/*
normalize( // normalize函数作用为 归一化数据
InputArray src, // 输入数组
InputOutputArray dst, // 输出数组,数组的大小和原数组一致
double alpha = 1, // 1,用来规范值,2.规范范围,并且是下限
double beta = 0, // 只用来规范范围并且是上限
int norm_type = NORM_L2, // 归一化选择的数学公式类型
int dtype = -1, // 当为负,输出在大小深度通道数都等于输入,当为正,输出只在深度与输如不同,不同的地方由dtype决定
InputArray mask = noArray() // 掩码。选择感兴趣区域,选定后只能对该区域进行操作
);
值归一化举例说明: 参考博客 https://blog.csdn.net/cosmispower/article/details/64457406
src={10,23,71},参数 beta 设为0,值的范围为 0-参数alpha 设置的值,例子中alpha设置为1
NORM_L1运算后得到 dst={0.096,0.221,0.683} NORM_* 的归一化公式参考上述博客
NORM_INF运算后得到 dst={0.141,0.324,1}
NORM_L2运算后得到 dst={0.133,0.307,0.947}
NORM_MINMAX运算得到 dst={0,0.377,1}
范围归一化时,beta必有值不等于0,范围为 alpha-beta ,alpha为下限(可为0也可非0),beta为上限
*/
normalize(b_hist, b_hist, 0, hist_cols, NORM_MINMAX, -1, Mat());//b_hist中元素的值转换到 0-hist_cols 之间
normalize(g_hist, g_hist, 0, hist_cols, NORM_MINMAX, -1, Mat());
normalize(r_hist, r_hist, 0, hist_cols, NORM_MINMAX, -1, Mat());//传参 0, hist_cols 或 hist_cols, 0 结果一致
//绘制直方图
Mat histImage(hist_rows, hist_cols, CV_8UC3, Scalar(0, 0, 0));
for (int i = 1; i < histBins; i++)
{
// cvRound 四舍五入,返回整型值
line(histImage, Point((i - 1)*bin_w, hist_cols - cvRound(b_hist.at<float>(i - 1))),
Point(i*bin_w, hist_cols - cvRound(b_hist.at<float>(i))), Scalar(255, 0, 0), 2, LINE_AA);
line(histImage, Point((i - 1)*bin_w, hist_cols - cvRound(g_hist.at<float>(i - 1))),
Point(i*bin_w, hist_cols - cvRound(g_hist.at<float>(i))), Scalar(0, 255, 0), 2, LINE_AA);
line(histImage, Point((i - 1)*bin_w, hist_cols - cvRound(r_hist.at<float>(i - 1))),
Point(i*bin_w, hist_cols - cvRound(r_hist.at<float>(i))), Scalar(0, 0, 255), 2, LINE_AA);
}
imshow("histImage", histImage);
waitKey(0);
}
效果图