架构
这里我们用第三方的exporter采集机器数据,prometheus直接从exporter的实例pull数据,然后用grafana展现和告警。
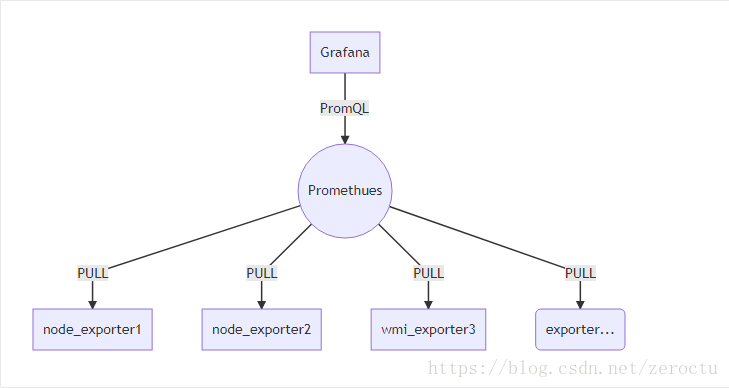
grafana可以选择多个数据来源,所以机器较多时,我们可以配置多个prometheus汇集数据,再统一由grafana展现,一般可以按照地域、业务、机房等维度进行划分。
Exporter
这里我们仅仅监控机器的流量、CPU、内存、磁盘等基本信息,因此选用的exporter如下:
- linux机器:node_exporter
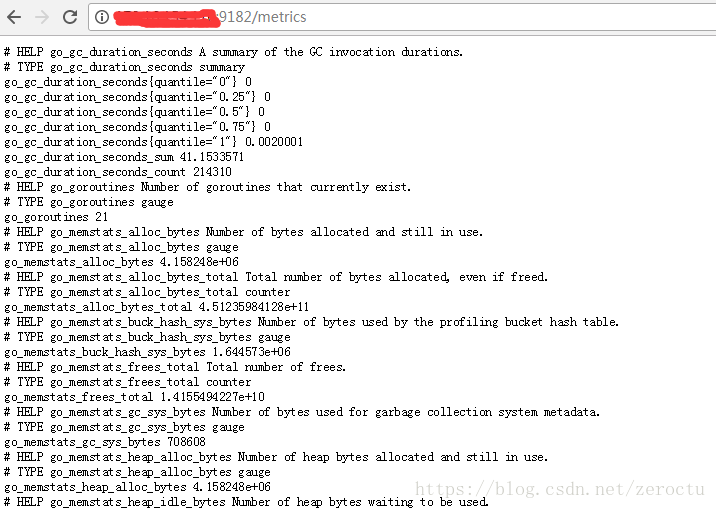
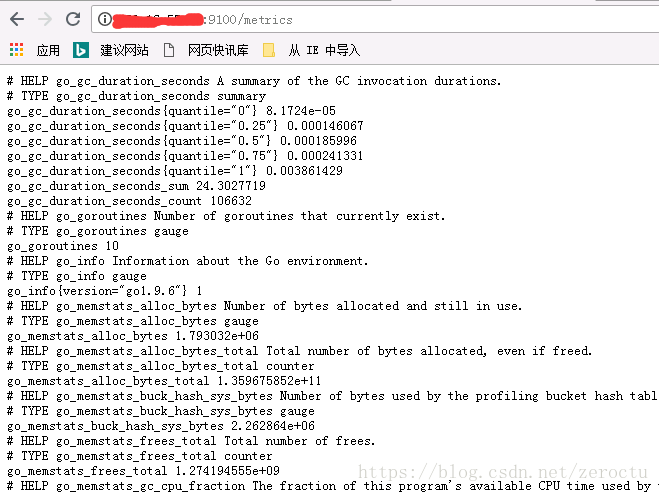
https://github.com/prometheus/node_exporter/releases/download/v0.16.0/node_exporter-0.16.0.linux-amd64.tar.gz - win机器: wmi_exporter
https://github.com/martinlindhe/wmi_exporter/releases/download/v0.3.3/wmi_exporter-0.3.3-amd64.msi
分别下载对应的exporter,解压,直接run,对于linux访问9100端口,对于win访问9182端口,如下说明exporter已经开始采集数据了。
Prometheus
prometheus是跨平台的,前往https://prometheus.io/download/下载,解压。win平台直接运行:
prometheus.exelinux平台运行:
./prometheus --config.file=prometheus.yml --web.listen-address=:9099关于启动的参数说明–help说明的非常详细
prometheus.yml配置文件
# my global config
global:
  scrape_interval:     15s # Set the scrape interval to every 15 seconds. Default is every 1 minute.
  evaluation_interval: 15s # Evaluate rules every 15 seconds. The default is every 1 minute.
  # scrape_timeout is set to the global default (10s).

# Alertmanager configuration
alerting:
  alertmanagers:
  - static_configs:
    - targets:
      # - alertmanager:9093

# Load rules once and periodically evaluate them according to the global 'evaluation_interval'.
rule_files:
  # - "first_rules.yml"
  # - "second_rules.yml"

# A scrape configuration containing exactly one endpoint to scrape:
# Here it's Prometheus itself.
scrape_configs:
  # The job name is added as a label `job=<job_name>` to any timeseries scraped from this config.
  - job_name: 'node'
    static_configs:
    - targets: ['xxx.xx.xx.xxx:9182']
      labels: {'name':'node_hf_xxx','ip':'xxx.xx.xx.xxx','area':'hf'}
    - targets: ['xxx.xx.xx.xxx:9100']
      labels: {'name':'node_hf_xxx','ip':'xxx.xx.xx.xxx','area':'hf'}
这里我们主要关注scrape_configs的配置,设置了job的name为node,同时设置了一些labels,目的是为了后面grafana展现的时候,根据这些lables进行搜索,方便数据的分类。
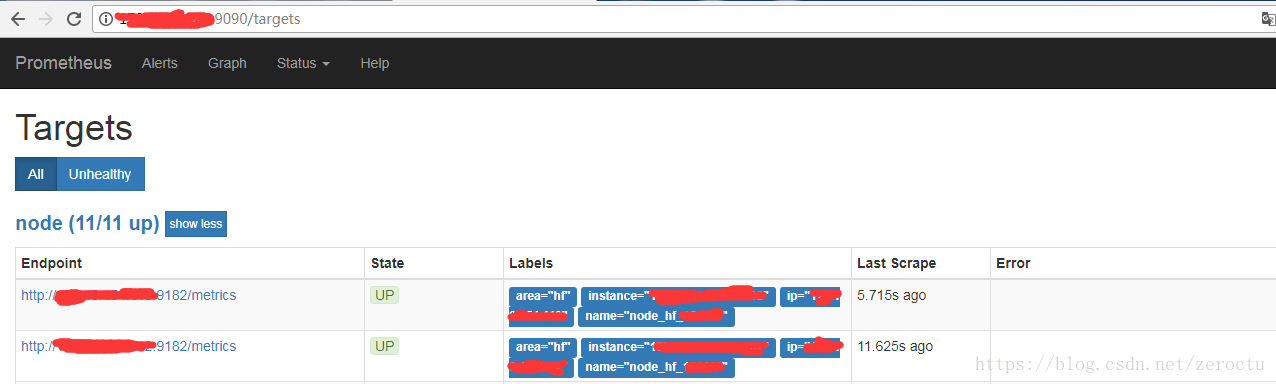
访问9090端口,展现如下说明prometheus已经成功的pull数据了。
Grafana
grafana不仅仅支持prometheus的展现,还支持ES、InfluxDB、OpenTSDB、MYSQL、SQL SERVER等等数据源,下载地址:
https://grafana.com/grafana/download
这里我们是win平台安装的grafana,下载解压后直接运行exe文件,若是centos可以安装官方文档直接yum安装,详见:http://docs.grafana.org/installation/rpm/
我们主要看一下grafana的配置文件
win平台
./conf/defaults.inicentos
/etc/grafana/grafana.ini配置文件我们主要关注邮箱的配置,这里的邮箱就是报警的时候发送人的配置
#################################### SMTP / Emailing #####################
[smtp]
enabled = true
host = mail.domain.com:25
user = xxxxx
# If the password contains # or ; you have to wrap it with triple quotes. Ex """#password;"""
password = xxxxxx
cert_file =
key_file =
skip_verify = true
from_address = xxxxx@domain.com
from_name = Grafana
ehlo_identity =
另外可以设置一下初始登录的用户名和密码
#################################### Security ############################
[security]
# default admin user, created on startup
admin_user = xxxxx

# default admin password, can be changed before first start of grafana,  or in profile settings
admin_password = xxxxxx访问http://ip:3000显示如下,说明grafana运行成功
登录,配置数据源:
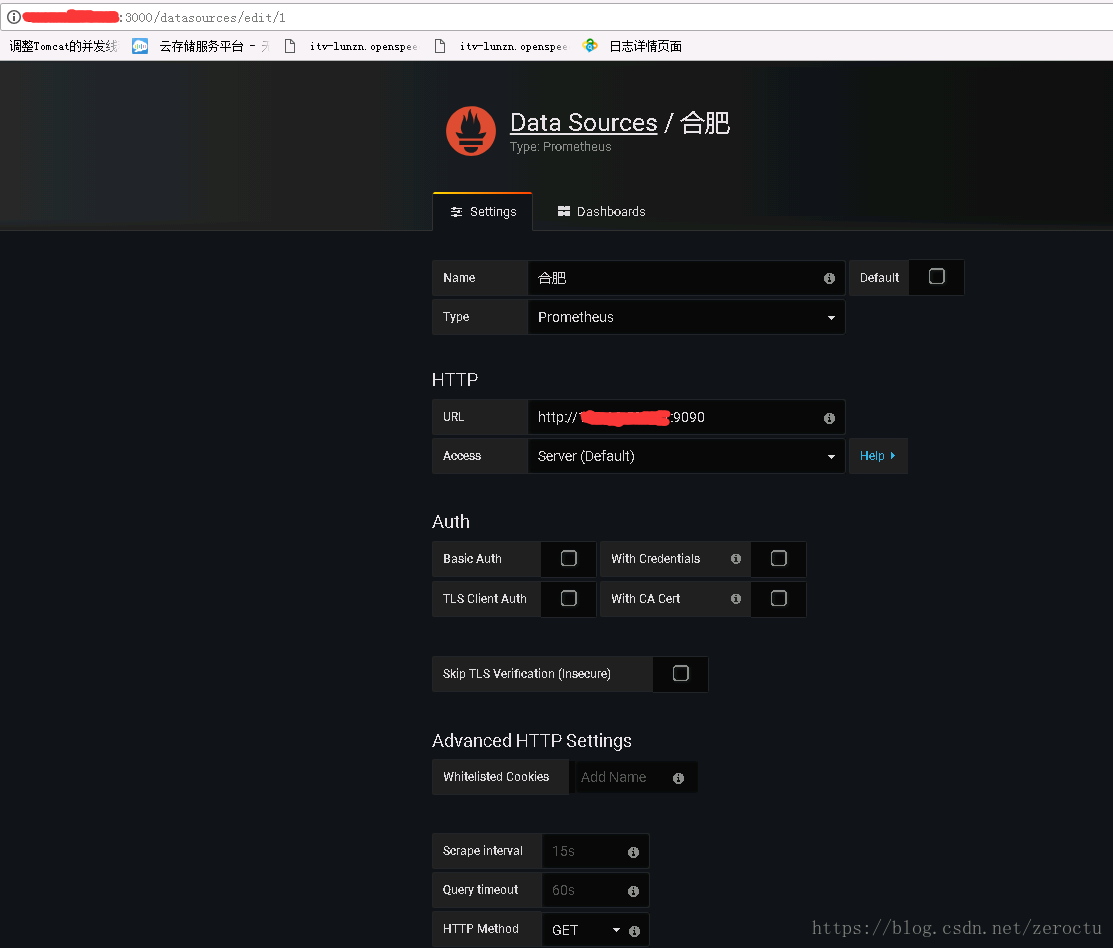
这里我们按照地域划分的数据源,将name命名为合肥。
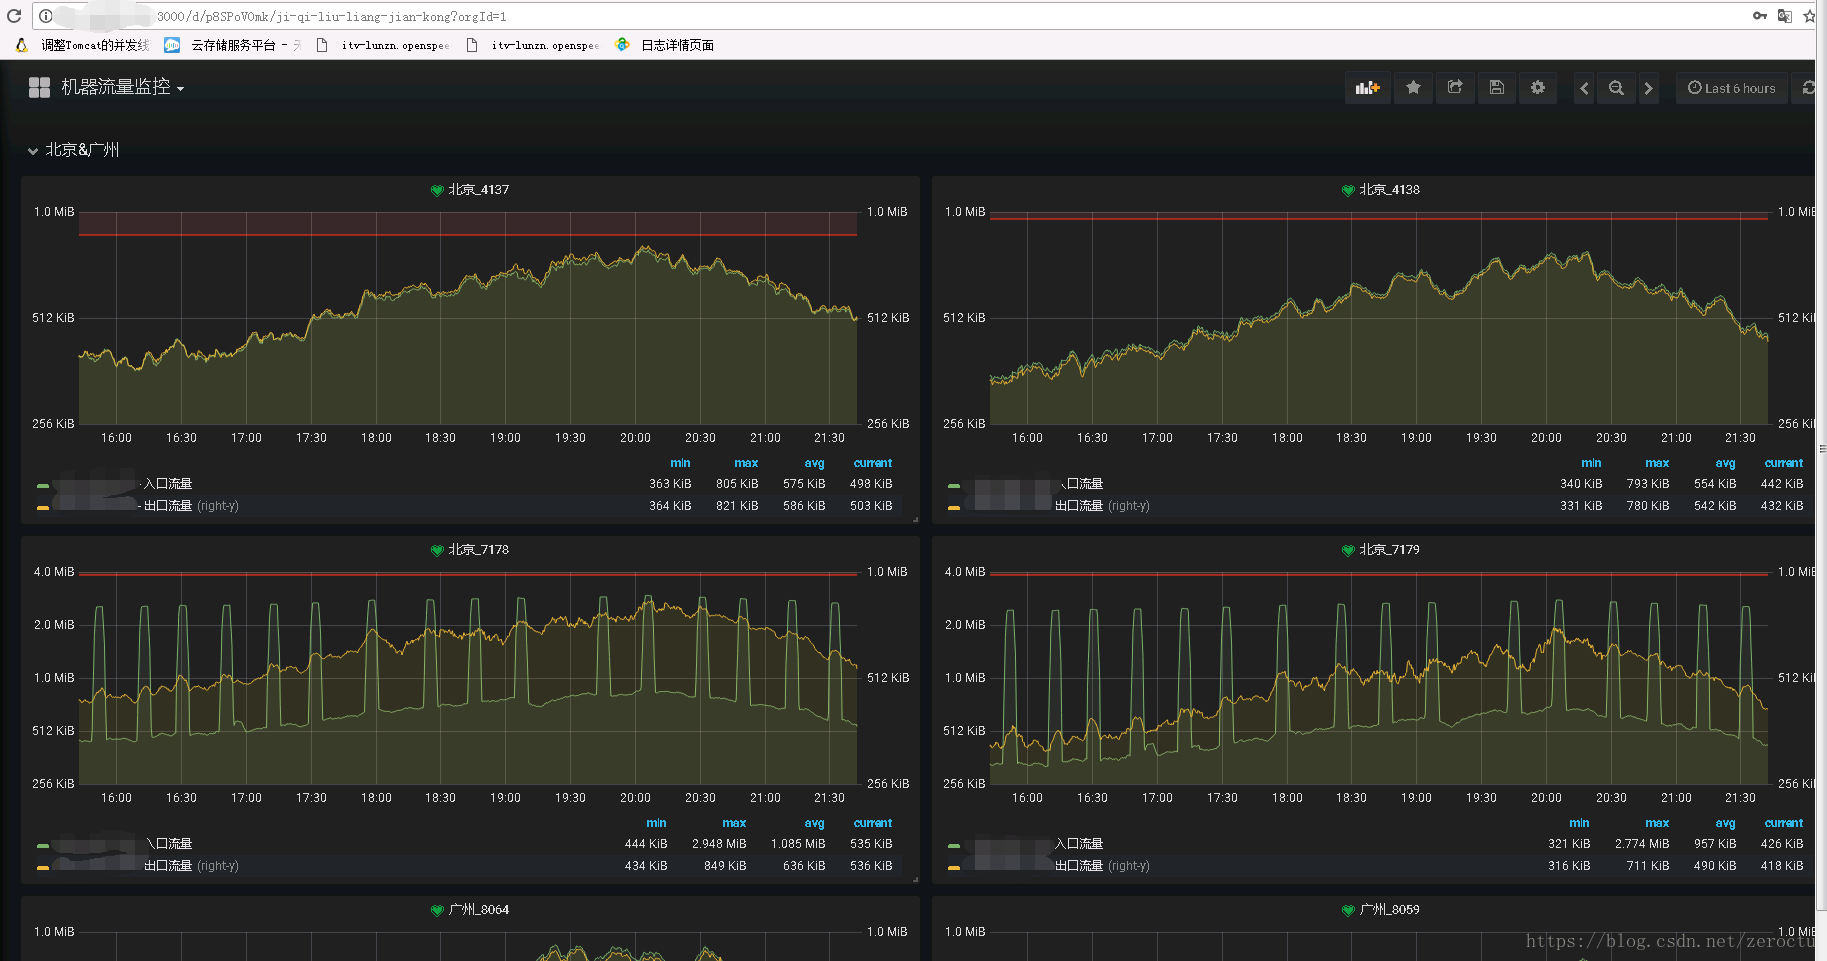
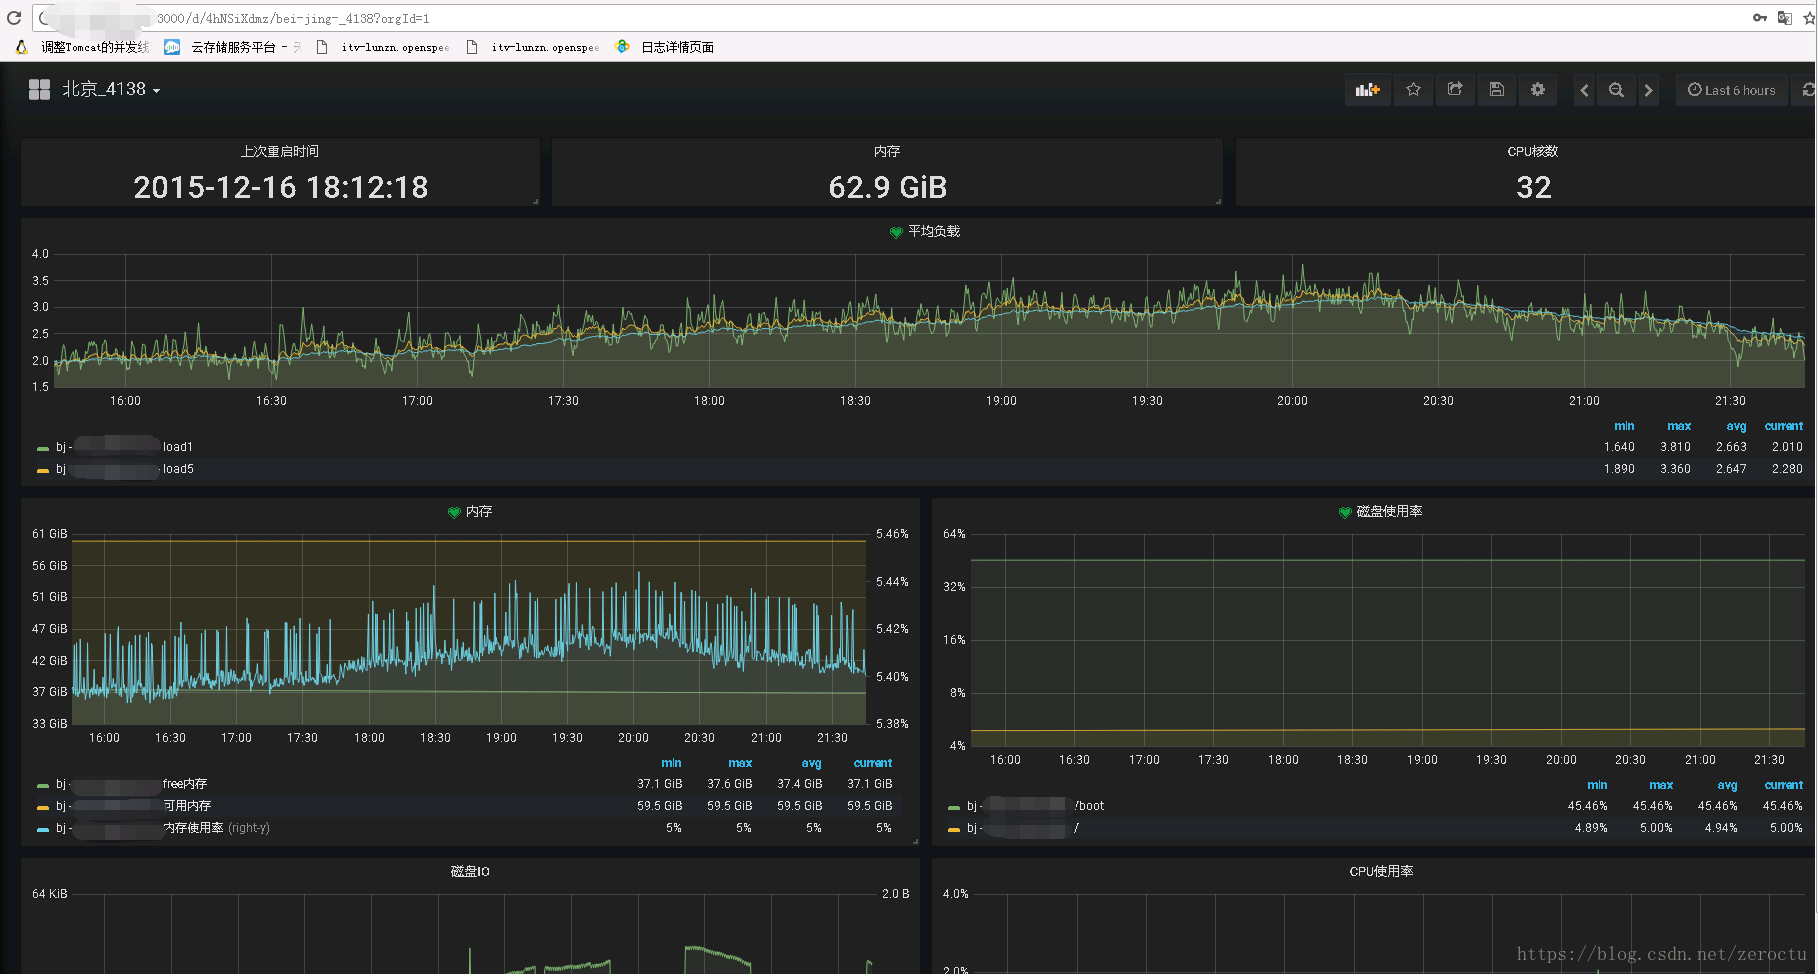
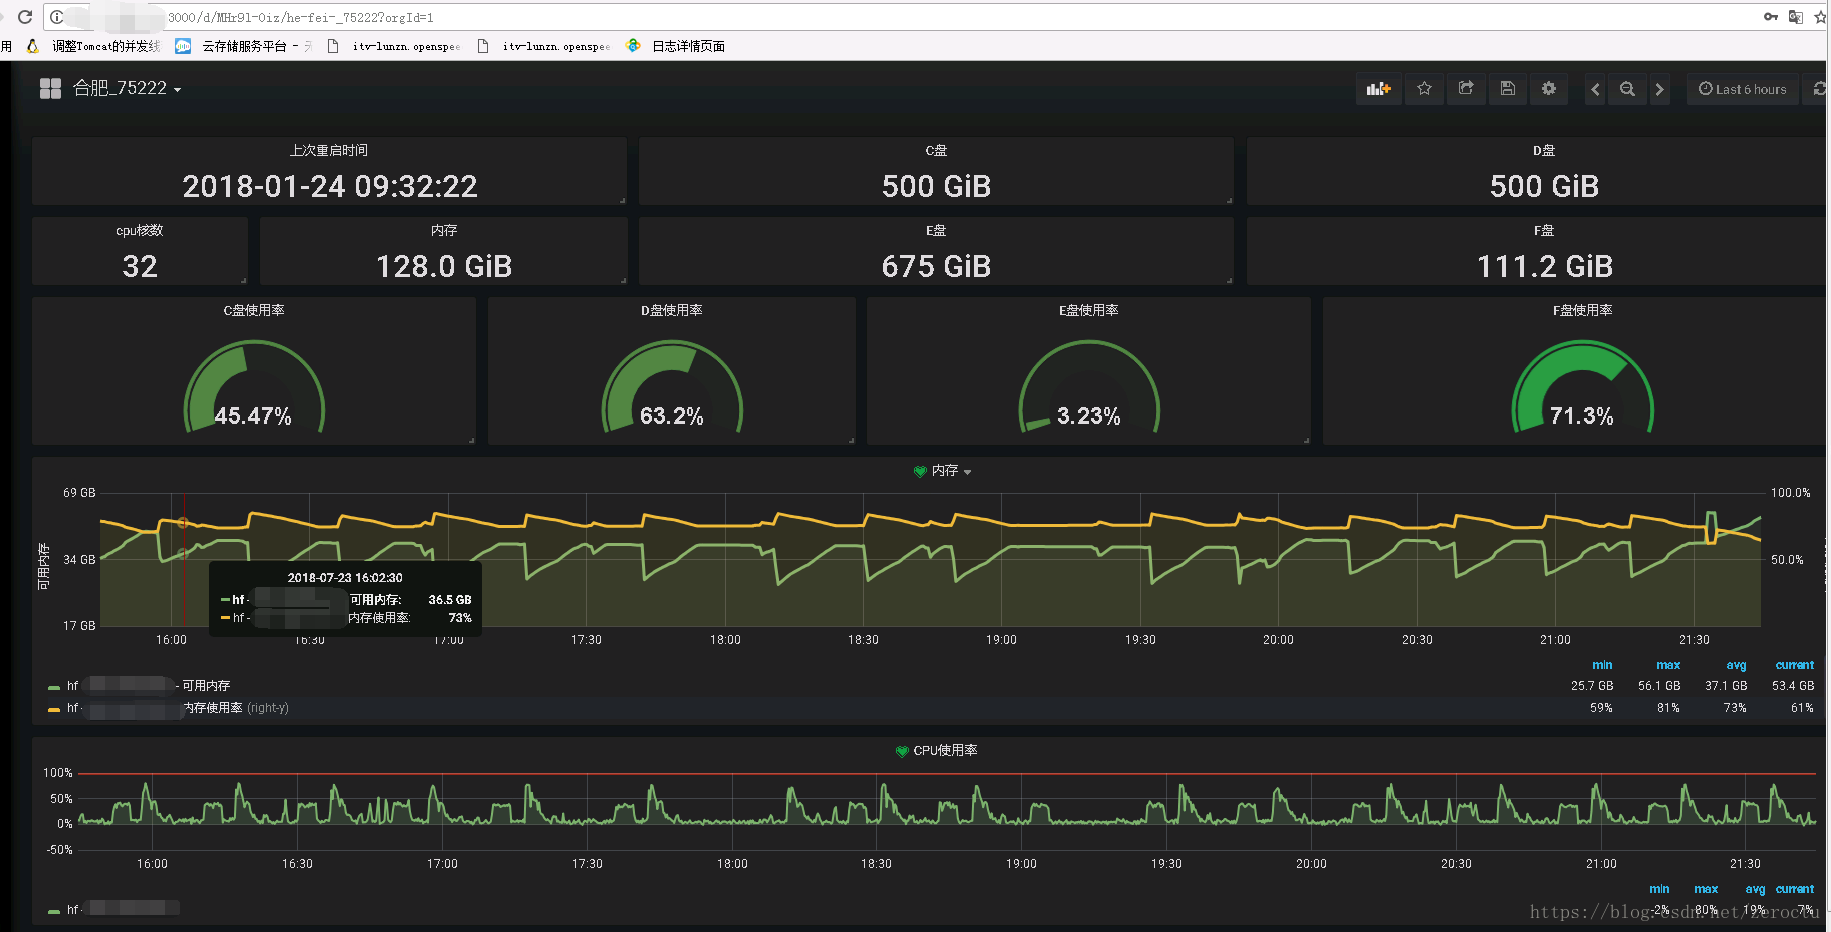
监控数据展现效果:
将在第3篇文章介绍以上展示效果的promQL语句