在《动态执行流程分析和性能瓶颈分析的利器——valgraind的callgrind》中,我们领略了valgrind对流程和性能瓶颈分析的强大能力。本文将介绍拥有相似能力的gperftools的Cpu Profiler。(转载请指明出于breaksoftware的csdn博客)
我们依然以callgrind一文中的例子为例
#include <thread>
#include <unistd.h>

class base {
public:
    virtual void calc_num() = 0;
public:
    void add_num () {
        n++;
    }
protected:
    unsigned long long n;
};


class inheritA final :
    public base
{
public:
    void calc_num() {
        n = _calc();
    }
private:
    unsigned long long _calc() {
        return 0;
    }
};

class inheritB final :
    public base
{
public:
    void calc_num() {
        n = 0;
    }
};

void thread_routine(base* obj_ptr) {
    while (true) {
        obj_ptr->calc_num();
        obj_ptr->add_num();
    }
}

int main() {
    base* t1_data = new inheritA;
    std::thread t1(thread_routine, t1_data);
    t1.detach();

    base* t2_data = new inheritB;
    std::thread t2(thread_routine, t2_data);
    t2.detach();

    sleep(10);
    return 0;
}
这段代码启动了两个线程,分别执行inheritA和inheritB的calc_num和add_num方法。其中calc_num被inheritA和inheritB分别实现,add_num则是其基类base实现的。
我们使用如下指令编译
g++ cpu_profiler.cpp -g -ltcmalloc_and_profiler -lpthread -std=c++11 -o cpu_profiler这次我们主要链接了profiler和tcmalloc,官方文档上说只要链接profiler就行,但是经过我测试,必须要同时链接这两个库才可以使用下面的方式去分析
CPUPROFILE=cpu_perf.prof ./cpu_profiler这样在当前目录下产生了cpu_perf.prof文件。对于这个文件,我们还需要使用pprof去分析
pprof --text ./cpu_profiler cpu_perf.prof
上面指令指出使用text形式输出
Using local file ./cpu_profiler.
Using local file cpu_perf.prof.
Total: 1919 samples
     726  37.8%  37.8%     1919 100.0% thread_routine
     725  37.8%  75.6%      725  37.8% base::add_num
     220  11.5%  87.1%      307  16.0% inheritA::calc_num
     161   8.4%  95.5%      161   8.4% inheritB::calc_num
      87   4.5% 100.0%       87   4.5% inheritA::_calc
       0   0.0% 100.0%     1919 100.0% __GI___clone
       0   0.0% 100.0%     1919 100.0% start_thread
       0   0.0% 100.0%     1919 100.0% std::__invoke
       0   0.0% 100.0%     1919 100.0% std::__invoke_impl
       0   0.0% 100.0%     1919 100.0% std::error_code::default_error_condition
       0   0.0% 100.0%     1919 100.0% std::thread::_Invoker::_M_invoke
       0   0.0% 100.0%     1919 100.0% std::thread::_Invoker::operator
       0   0.0% 100.0%     1919 100.0% std::thread::_State_impl::_M_run
需要注意的是,这段不是调用堆栈,而是各个操作自身耗时的排序。
为了更直观的表达流程,我们可以使用callgrind方式输出分析结果
pprof --callgrind ./cpu_profiler cpu_perf.prof > cpu_perf.out然后使用kcachegrind可视化去查看
kcachegrind cpu_perf.out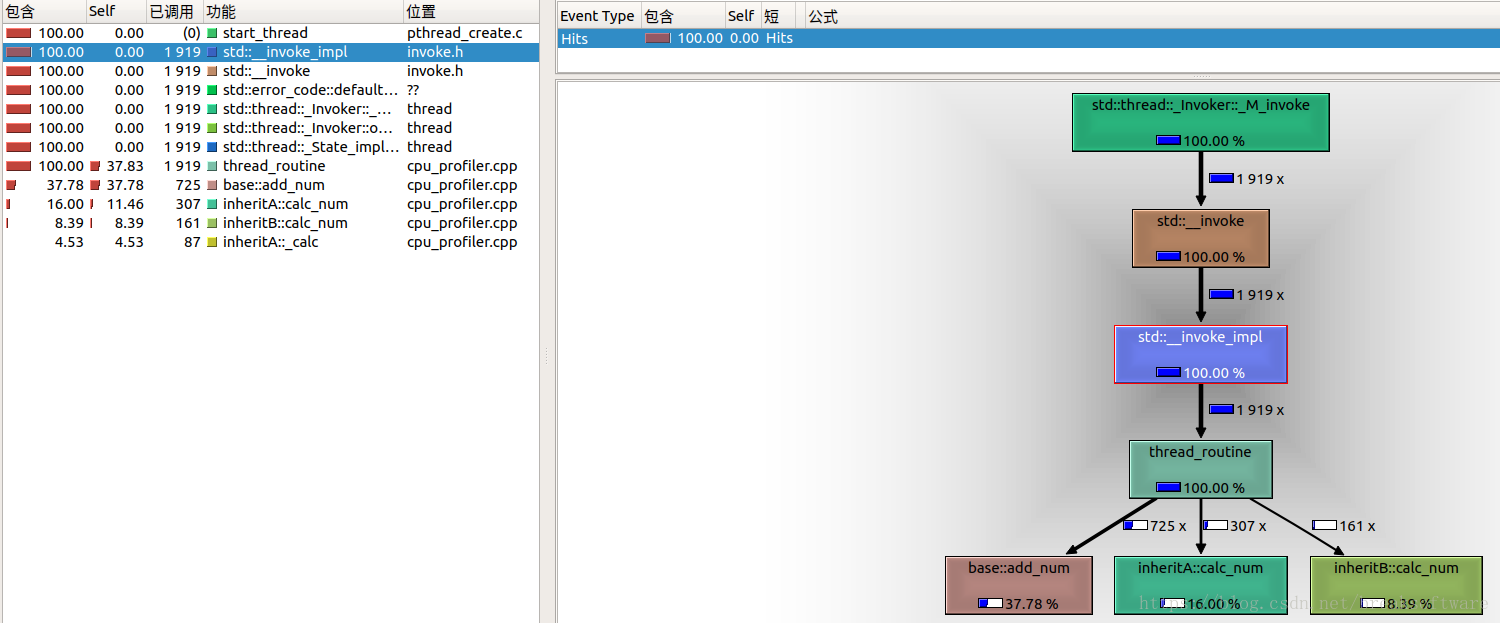
可以发现gperftools并没有像valgrind区分线程,而将所有线程的调用过程在一个大过程中体现出来。比如thread_routine的下游分别是inheritA的calc_num和inheritB的calc_num,而在一个线程中,是不可能同时调用到这两个过程。
图中数据的解决和valgrind产生的结果是类似的。self列代表自身耗时,我们看到thread_routine和base::add_num这两个函数自身占用的CPU是最高的,这往往是我们程序优化关注的重点。
我们看一个实际的例子
#include <unistd.h>
#include <stdlib.h>
#include <thread>
#include <iostream>

void thread_routine(unsigned long long n) {
    while (true) {
        const int array_size = 4 * 1024 * 1024;
        char buf[array_size] = {0};
        sprintf(buf, "%lu\n", n++);
        printf(buf);
    }
}

int main() {
    std::thread t(thread_routine, 0);
    t.detach();
    sleep(10);
    return 0;
}
这段代码打印出不停自增的数字,如果数字越大,我们可以认为性能越高。最终上面的程序打印到42310。
使用Cpu Profiler分析它结果如下图

图中显示memset函数自身耗时最长,基本占用了整个程序的CPU资源。我们查看代码,发现其8~9行申请了4M的空间,并且将其设置为空。如何优化呢?我们可以将其空间变小,使得memset操作空间减少以提高性能。我们将空间改成32字节。其执行结果到1640773,是之前方案(42310)38倍。
这个时候,我们再看下其执行流程

可以发现,其主要耗时在“往设备上写”这个操作上了。
最后提一句,如果不能修改待分析程序的链接库,则可以使用下面指令来分析
LD_PRELOAD="/usr/local/lib/libprofiler.so" CPUPROFILE=cpu_perf.prof ./cpu_profiler