数学建模系列——插值拟合
——————————————————————————
插值拟合的公式到现在没看懂,可能是自己数学基础太差了吧,仅知道他们的区别,仅会写代码,理论真不会,真不会……
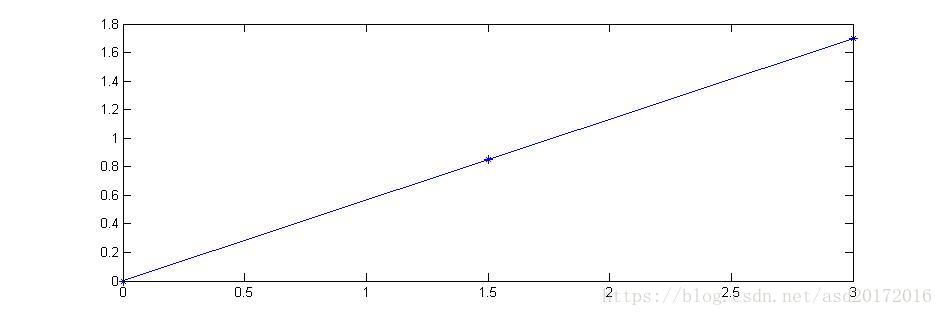
线性插值(linear)
靠近的两个点用直线连接,在对应点选取插值,插值点为
。如下图。
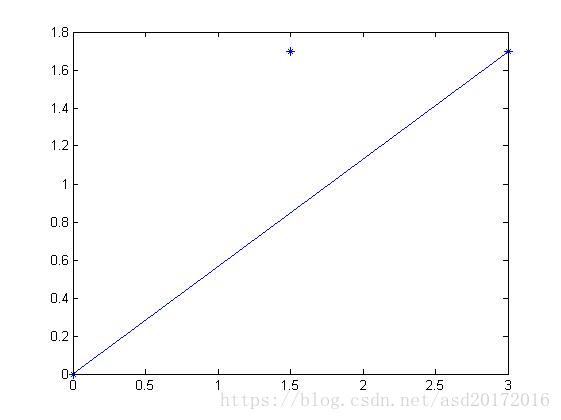
最近点插值(nearest)
选取距离数据点最近的点作为插值点,插值点为
。看下图。
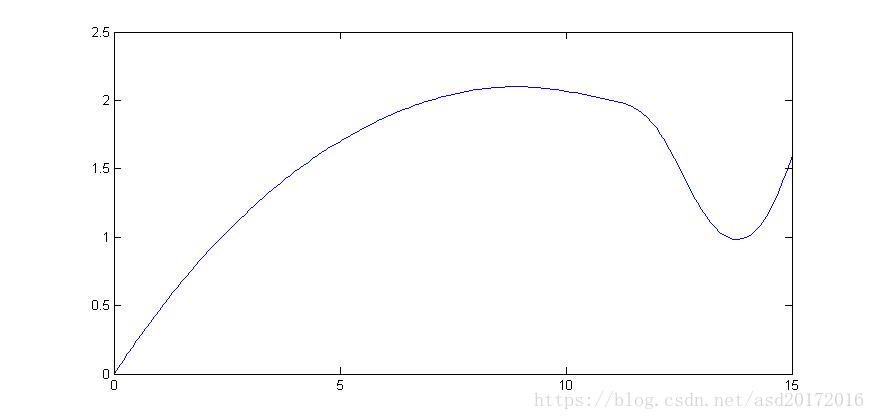
分段三次艾尔米特插值(phcip)
曲线光滑,具有保形性。
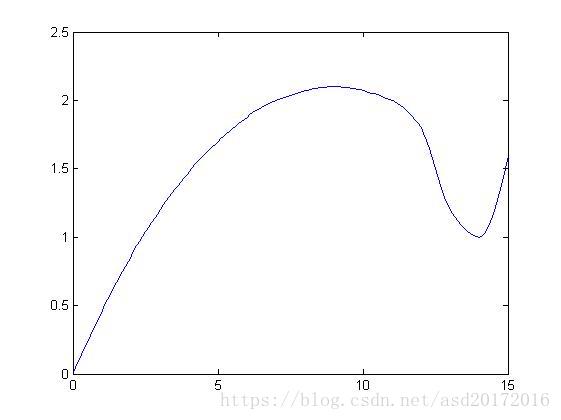
样条插值(spline)
曲线光滑,连续,曲率也连续,工程中有较高要求才产生了样条插值。
clear;
x = [0, 3, 5, 7, 9, 11, 12, 13, 14, 15];
y = [0, 1.2, 1.7, 2.0, 2.1, 2.0, 1.8, 1.2, 1.0, 1.6];
x1 = 0:0.1:15;
y1 = interp1(x, y, x1, 'spline');
% one dimension interpolation,
% x1 is the interpolated data,
% spline is the interpolate method, which includes linear,nearst,pchip,spline.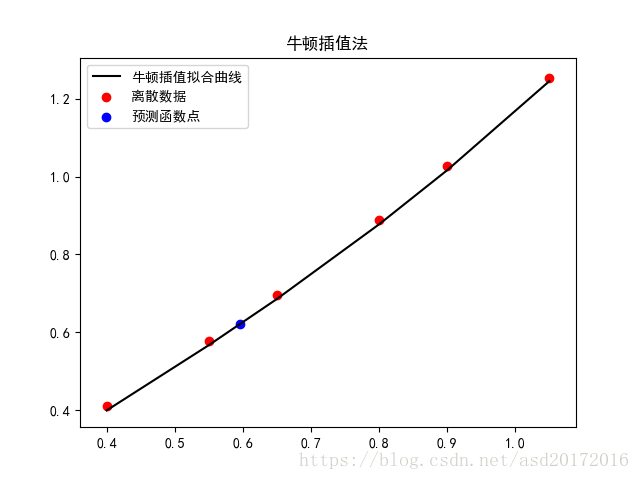
plot(x1, y1)牛顿插值
用差分的思想,构造函数无限逼近原函数。
import matplotlib.pyplot as plt
from pylab import mpl
import math

x = [0.4, 0.55, 0.65, 0.80, 0.90, 1.05]
y = [0.41075, 0.57815, 0.69675, 0.88811, 1.02652, 1.25382]

"""计算五次差商的值"""
def difference_quotient(x, y, k):
    # i记录计算差商的次数,这里循环5次,计算5次差商。
    i = 0
    quotient = [0, 0, 0, 0, 0, 0]
    while i < k:
        j = 5
        while j > i:
            if i == 0:
                quotient[j]=((y[j]-y[j-1])/(x[j]-x[j-1]))
            else:
                quotient[j] = (quotient[j]-quotient[j-1])/(x[j]-x[j-1-i])
            j -= 1
        i += 1
    return quotient;

def function(data):
    return x[0]+parameters[1]*(data-x[0])+parameters[2]*(data-x[0])*(data-x[1])+\
           parameters[3]*(data-x[0])*(data-x[1])*(data-x[2])\
           +parameters[4]*(data-x[0])*(data-x[1])*(data-x[3])

"""计算插值多项式的值和相应的误差"""
def calculate_data(x,parameters):
    returnData=[];
    for data in x:
        returnData.append(function(data))
    return returnData

"""画函数的图像
newData为曲线拟合后的曲线
"""

def draw(newData):
    plt.scatter(x,y,label="离散数据",color="red")
    plt.plot(x,newData,label="牛顿插值拟合曲线",color="black")
    plt.scatter(0.596, function(0.596),label="预测函数点",color="blue")
    plt.title("牛顿插值法")
    mpl.rcParams['font.sans-serif'] = ['SimHei']
    mpl.rcParams['axes.unicode_minus'] = False
    plt.legend(loc="upper left")
    plt.show()

parameters = difference_quotient(x,y,5)
yuanzu = calculate_data(x, parameters)
draw(yuanzu)多项式拟合
与插值的最大区别是,插值过数据点,而拟合不用。相同的是都是构造个曲线,去无限逼近源数据,使得误差最小。
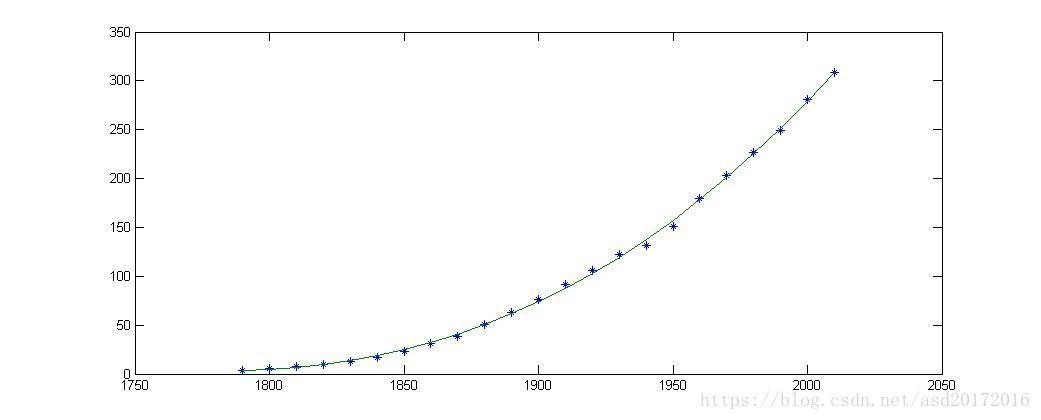
x = 1790:10:2010;
y = [3.9,5.3,7.2,9.6,12.9,17.1,23.2,31.4,38.6, 50.2,63.0,76.0,92.0,105.7,122.8,131.7,150.7,179.3,203.2,226.5,248.7,281.4,308.7];
plot(x,y,'*');
p = polyfit(x,y,3); % 3 means the number of fitting items
polyval(p, 2020)    % forecast 2010
plot(x, y, '*', x, polyval(p, x));
polyval(p, 2016)
还推荐matlab的拟合工具箱,是真的好使。。。工具、基本拟合、选择函数的最高次项,输出你和函数和残差模。残差模是衡量拟合效果的指标,越小越好(前提是避免龙格现象),计算方法是:原函数的点和拟合的点的差的平方,在对所有点求和。就是那个下面的式子。