本系列(pyecharts进阶用法)将给大家介绍和讲解一些pyecharts里的细节问题,让大家能将数据分析和可视化更好的结合,同时也给用户更
好的视觉体验。(获取更多学习资源请微信关注:极简XksA(账号:xksnh888))
一、改变主题
1.基本介绍
简介:echarts 自带 dark 主题, pyecharts 也就自带了 dark。 echarts-themes-pypkg 提供了 vintage, macarons, infographic, shine 和 roma 主题。
安装:
$ pip install echarts-themes-pypkg
2.test_Theme
(1)源代码
from pyecharts import Bar
v1 = [20,25,35,24]
str1 = ['回忆','生活','现实','失败']
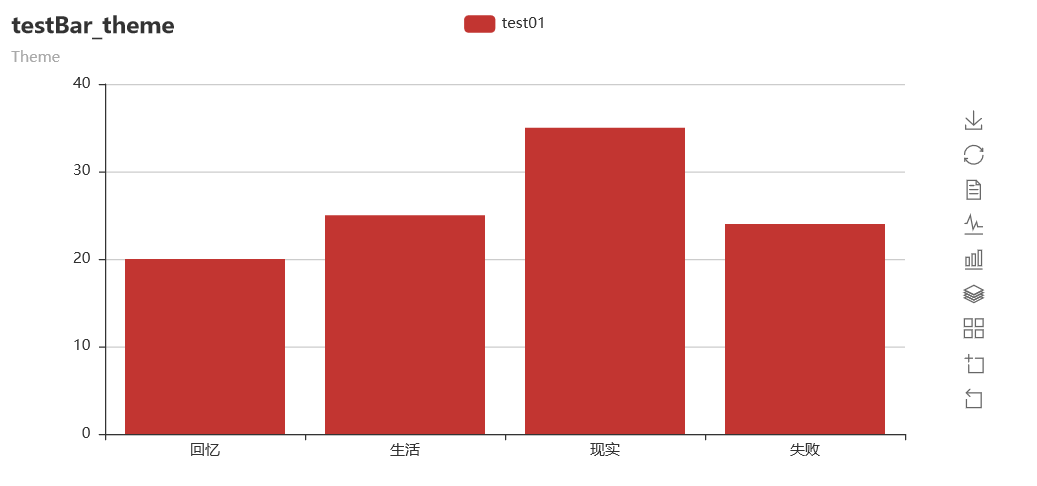
bar1 = Bar('testBar_theme','Theme')
bar1.add('test01',str1,v1,is_more_utils = True)
bar1.render()
显示效果:
(2)更改主题
- 单个图换主题:
from pyecharts import Bar
v1 = [20,25,35,24]
str1 = ['回忆','生活','现实','失败']
bar = Bar('testBar_theme','Theme')
bar.add('test01',str1,v1,is_more_utils = True)
# 更换单个图表主题
# 其他主题:vintage,macarons,infographic,shine,roma
bar.use_theme("vintage")
bar.render()
显示效果:
- 整个页面使用同一个主题:
from pyecharts import configure
configure(global_theme='vintage')
显示效果:

二、基本配置
1.在Bar()函数里添加的参数
title -> str
主标题文本,支持 \n 换行,默认为 “”subtitle -> str
副标题文本,支持 \n 换行,默认为 “”width -> int
画布宽度,默认为 800(px)height -> int
画布高度,默认为 400(px)title_color -> str
主标题文本颜色,默认为 ‘#000’subtitle_color -> str
副标题文本颜色,默认为 ‘#aaa’
background_color -> str
画布背景颜色,默认为 ‘#fff’
page_title -> str
指定生成的 html 文件中<title>标签的值。默认为’Echarts’renderer -> str
指定使用渲染方式,有 ‘svg’ 和 ‘canvas’ 可选,默认为 ‘canvas’。3D 图仅能使用 ‘canvas’(canvas和svg区别请参考:https://blog.csdn.net/helloword_chen/article/details/49788309 )
具体使用
代码
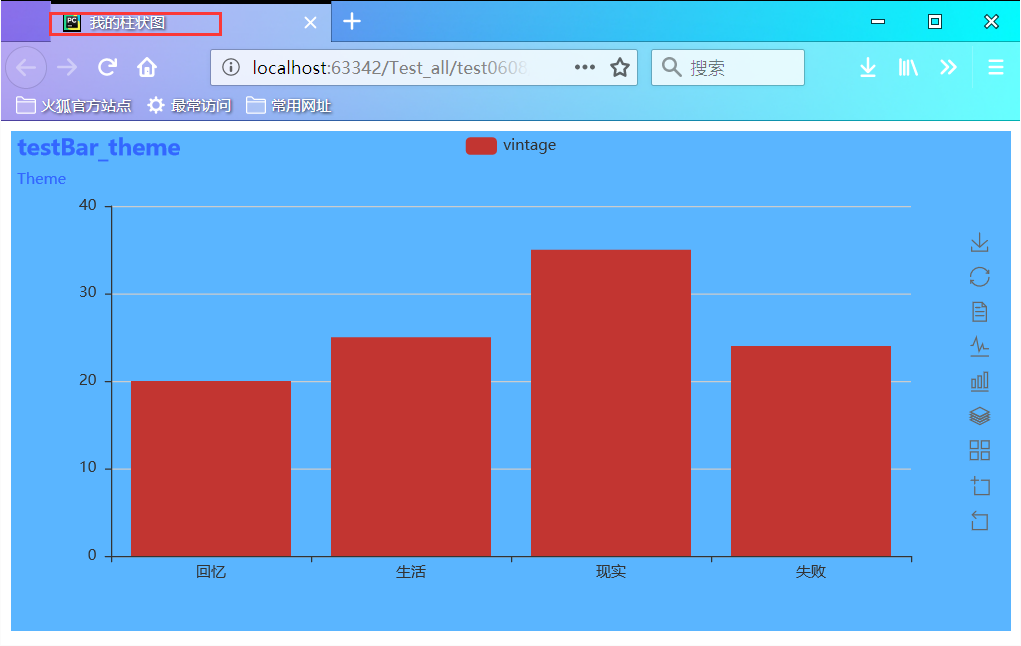
from pyecharts import Bar
v1 = [20,25,35,24]
str1 = ['回忆','生活','现实','失败']
# 默认Bar()第一个参数为 主标题,第二个参数为副标题
bar1 = Bar('testBar_theme','Theme',page_title  = '我的柱状图',title_color  ='#3367FF',subtitle_color= '#3367FF',background_color = '#5AB5FF')
bar1.add('vintage',str1,v1,is_more_utils = True)
bar1.render(r"H:\PyCoding\FlaskCoding\Test_all\test0608\test01.html")
显示效果
2.在add()函数里添加的参数
is_random -> bool
是否随机排列颜色列表,默认为 Falselabel_color -> list
自定义标签颜色。全局颜色列表,所有图表的图例颜色均在这里修改。如 Bar 的柱状颜色,Line 的线条颜色等等。is_label_show -> bool
是否正常显示标签,默认不显示。标签即各点的数据项信息label_pos -> str
标签的位置,Bar 图默认为’top’。有’top’, ‘left’, ‘right’, ‘bottom’, ‘inside’,’outside’可选label_text_color -> str
标签字体颜色,默认为 “#000”label_text_size -> int
标签字体大小,默认为 12is_random -> bool
是否随机排列颜色列表,默认为 Falselabel_formatter -> function
回调函数使用
def label_formatter(params):
      return params.value + ' [Good!]'
(params: Object|Array) => string 参数 params 是 formatter 需要的单个数据集。格式如下: { componentType: 'series', // 系列类型 seriesType: string, // 系列在传入的 option.series 中的 index seriesIndex: number, // 系列名称 seriesName: string, // 数据名,类目名 name: string, // 数据在传入的 data 数组中的 index dataIndex: number, // 传入的原始数据项 data: Object, // 传入的数据值 value: number|Array, // 数据图形的颜色 color: string, }
具体使用
代码
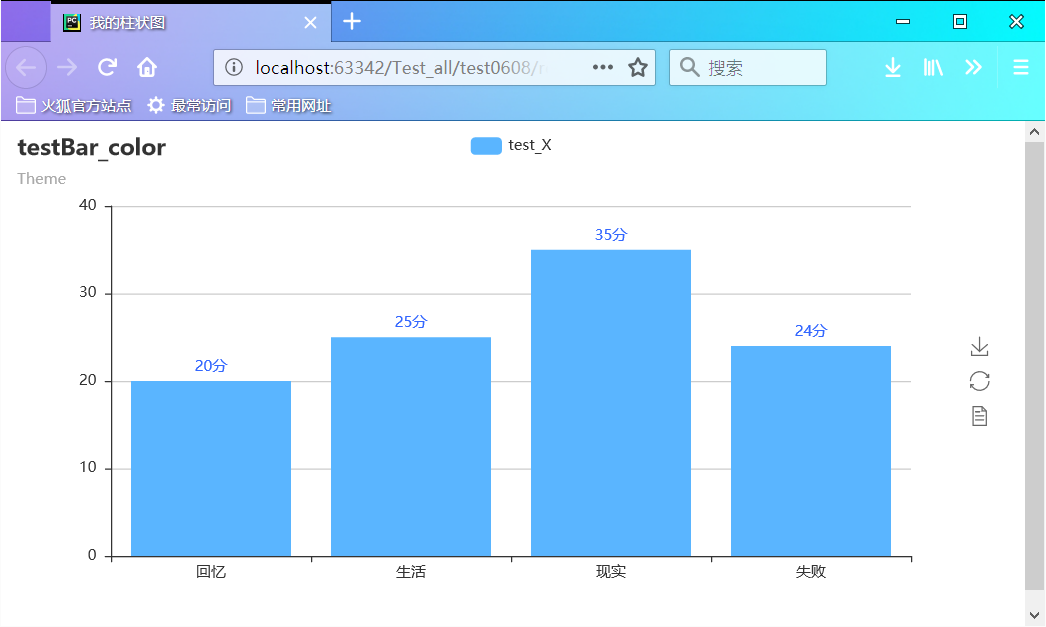
from pyecharts import Bar
def label_formatter(params):
    return params.data +'分'
v1 = [20,25,35,24]
attr = ['回忆','生活','现实','失败']
bar = Bar('testBar_color','Theme',page_title  = '我的柱状图')
# 注意 label_color的属性值为 list(列表)
bar.add("test_X", attr, v1, is_label_show=True,label_color=['#5AB5FF'],label_text_color ='#3367FF',label_formatter=label_formatter)
bar.render()
显示效果