在放直方图的源码之前我先简单介绍下直方图,一般我都不会去介绍某种可视化图形是做什么的,如果一种图形不能让你对数据一目了然的话,那一定是你选错了展示方式。但直方图的概念还是有必要说一下,以免惯性思维造成了使用上的误解。
惯性思维:直方图和柱状图差不多?好像一样~
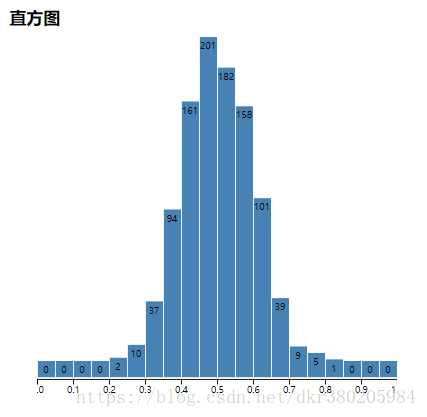
我也是这么想的,当然D3不会那么傻,实际上很好区分,柱状图表示散列点的数值展示,而直方图,表示的是某一区间的数据之和的量,比如某一年龄段的人有多少,这和某一年龄的人有多少有本质区别。
下面放上源码,仅供参考
<template>
  <div id='svgContainer' style="">
    <div class="every">
      <h3>直方图</h3>
      <div class="svg" id="histogram"></div>
    </div>
</template>
<script>
import * as d3 from 'd3'
export default {
  methods: {
     histogram () {
      let width = 400
      let height = 400
      let margin = {top: 10, right: 30, bottom: 30, left: 30}
      let data = d3.range(1000).map(d3.randomBates(10)) // 基于贝茨分布生成随机数,也不知道是个啥
      let xScale = d3.scaleLinear()
        .rangeRound([0, width]) // 设置输出范围并且启动四舍五入
      // 转换数据
      let histogram = d3.histogram()
        .domain(xScale.domain())
        .thresholds(xScale.ticks(20))
      let bins = histogram(data)
      // y比例尺
      let yScale = d3.scaleLinear()
        .domain([0, d3.max(bins, function (d) { return d.length })]) // 比较的是数据的length值
        .range([height - margin.bottom - margin.top, 0]) // 这里要倒着写,因为坐标轴原点在左上角
      // 绘图
      let svg = d3.select('#histogram')
        .append('svg')
        .attr('width', width)
        .attr('height', height)
        .attr('transform', 'translate(' + margin.left + ',' + margin.top + ')')
      let bar = svg.selectAll('.bar')
        .data(bins)
        .enter().append('g')
        .attr('class', 'bar')
        .attr('transform', function (d) { return 'translate(' + xScale(d.x0) + ',' + yScale(d.length) + ')' })
      bar.append('rect')
        .attr('x', 1)
        .attr('width', xScale(bins[0].x1) - xScale(bins[0].x0) - 1)
        .attr('height', function (d) { return height - yScale(d.length) - 22 }) // d.length记录了该区间的个数
        .attr('fill', 'steelblue')

      let formatCount = d3.format(',.0f')
      bar.append('text')
        .attr('dy', '.75em')
        .attr('y', 6)
        .attr('x', (xScale(bins[0].x1) - xScale(bins[0].x0)) / 2)
        .attr('text-anchor', 'middle')
        .attr('font-size', '10px')
        .text(function (d) { return formatCount(d.length) })

      svg.append('g')
        .attr('class', 'axis axis--x')
        .attr('transform', 'translate(0,' + (height - 20) + ')')
        .call(d3.axisBottom(xScale))
    }
  },
  mounted () {
    this.histogram()
  }
}
</script>
<style lang="less">
#svgContainer{
  width: 100%;
  height: 100%;
  .every{
    width: 400px;
    height: 425px;
    margin:15px;
    float: left;
    h3{
      margin:0;
      .button{
        float: right;
        margin-right: 20px;
        font-size: 14px;
        cursor: pointer;
        padding: 2px 8px;
        border:1px solid #ccc;
        background: yellowgreen;
        border-radius: 4px;
        &:hover{
          background: violet;
        }
      }
    }
    .svg{
      width: 400px;
      height: 400px;
    }
  }
}
</style>