#!/usr/bin/python2.7
import numpy as np
from matplotlib import pyplot as plt
from dbtools import raw_data
from utils import moving_sum
def moving_sum(array, window):
if type(array) is not np.ndarray:
raise TypeError('Expected one dimensional numpy array.')
remainder = array.size % window
if 0 != remainder:
array = array[remainder:]
array = array.reshape((array.size/window,window))
sum_arr = np.sum(array,axis=1)
return sum_arr
def run():
window = 3
y_lst = raw_data('2018-08-03 00:00:00', length=3600*24)
raw_arr = np.array(y_lst)
sum_arr = moving_sum(raw_arr,window)
res = np.true_divide(sum_arr[1:],sum_arr[:-1])
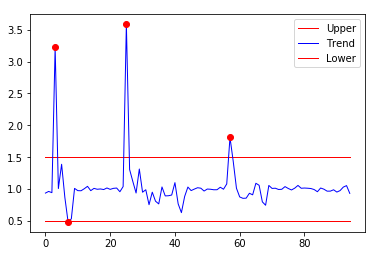
threshold = 0.5
upper = np.array([1+threshold]*res.size)
lower = np.array([1-threshold]*res.size)
plt.plot(upper,lw=1,color='red',label='Upper')
plt.plot(res,lw=1,color='blue',label='Trend')
plt.plot(lower,lw=1,color='red',label='Lower')
r_idx = np.argwhere(np.abs(res-1) > 0.5)
plt.plot(r_idx, res[r_idx], 'ro')
plt.legend()
plt.show()
return (r_idx,res[r_idx])