1.简单绘图
让图像显示出来的方法:
方法一:
plt.plot(a,b)
plt.show()
方法二:
%matplotlib inline
plt.plot(a, b)
# %timeit 表示代码执行的时间
%timeit
# 第三个参数表示线段的类型,
plt.plot(a, b, '--')
plt.plot(t,s,'r--',label='aaaa')
plt.plot(t*2, s, 'b--', label='bbbb')
plt.xlabel('this is x')
plt.ylabel('this is y')
plt.title('this is a demo')
# 使用plt.legendlegend将要显示的信息来自于上面代码中的label信息;
plt.legend()
# plt.plot()
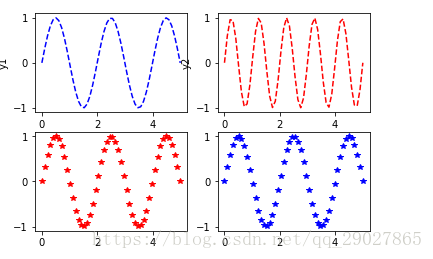
2.subplot绘子图
# subplot的参数的意思是2行2列,位置是1的subplor子图
plt.subplot(221)
plt.plot(x, y1, 'b--')
plt.ylabel('y1')
# 设置2行2列的第二个子图
plt.subplot(222)
plt.plot(x, y2, 'r--')
plt.ylabel('y2')
plt.xlabel('x')
# 设置2行2列的第三个子图
plt.subplot(223)
plt.plot(x, y1, 'r*')
plt.subplot(224)
plt.plot(x, y1, 'b*')
plt.show()
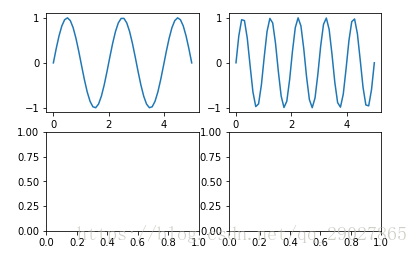
# 由plt.subplots返回的是一个元组;
# 元组的第一个元素表示画布;
# 第二个元素表示画图
# subplots的参数表示将画布分成几行几列
figure, ax = plt.subplots(2,2)
ax[0][0].plot(x, y1)
ax[0][1].plot(x, y2)
plt.show()
3.Pandas绘图之Series
#先构造Series的数据
# cumsum用法(求累计次数)
s1 = Series(np.random.randn(1000)).cumsum()
s2 = Series(np.random.randn(1000)).cumsum()
# grid参数是方格,
s1.plot(kind='line',grid=True, label='S1', title='This is Series')
s2.plot(label='S2')
plt.legend()
plt.show()
# 分成两行一列的子图
fig, ax = plt.subplots(2,1)
ax[0].plot(s1)
ax[1].plot(s2)
plt.show()
fig, ax = plt.subplots(2,1)
s1[0:10].plot(ax=ax[0], label='S1', kind='bar')
s2.plot(ax=ax[1], label='S2')
plt.show()
4.Dataframe画图与Series类似
df = DataFrame(
np.random.randint(1,10,40).reshape(10,4),
columns=['A','B','C','D']
)
# bar的意思是直方图,kind是线型图
df.plot(kind='bar')
plt.show()
5.matplotlib里的直方图和密度图
直方图:
s = Series(np.random.randn(1000))
plt.hist(s, rwidth=0.9)
密度图:
s.plot(kind='kde')
plt.show()