- 本文提出了一种新的估算应用在多核多任务的情况下的减速率的应用减速模型。该模型充分的考虑到了共享cache和主存争用所带来的影响,同时使用应用的请求整体行为来估算减速比。最后实验表明该模型能够在几乎不影响其它应用运行的情况下,比之前的模型估算错误率更低。同时论文还结合ASM模型,进一步改善了共享资源的管理的问题。
应用的减速
在多核多任务的情况下,某一个应用的减速情况使用shard−execution−timealone−execution−time这个比值来衡量
shared execution time:该应用与其它应用共同执行的时间
alone execution time:该应用单独在同一个系统中执行所需要的时间。这个时间更加难以测量,尤其是要求在系统运行过程中,不影响其它应用正常执行的情况下。
先前减速估计模型:
- STFM(stall time fair memory):使用程序独自占有主存运行时间和共享占用主存的运行时间的比值作为减速的估计。STFM会记录程序发出的每个请求由于其它应用的干扰所带来的阻塞延迟,但是由于大量的并行的存在,这个延迟会非常难以测量
- MISE(memory-interference induced slowdown estimation):该模型利用了一个现象:应用程序的性能与其内存请求服务速率相关。因此使用这个速率的比值来估计减速的程度。为了测量单独应用的内存请求速率,MISE定期向应用程序的请求提供访问内存的最高优先级。
- FST(fairness via source throttling)和PTCA(per-thread cycle accounting)两个模型给出了由于共享cache的容量和主存带宽的共享干扰所带来的应用的减速情况。FST和PTCA使用了类似于STFM模型中的方法来量化主存的干扰。为了量化共享cache带来的干扰,两者首先确定了哪些cache miss本来在单独使用cache的情况下是不会miss的cache 访问,同时记录了为了解决这些misses而增加的周期数。
- FST和PTCA的不同在于两者识别由于干扰所带来的cache miss的机制不同。FST使用了一个pollution filter来记录对于某个应用,那些由于其它应用而被替换出去的cache line。如果某次的cache 访问在cache中miss,但是在filter中命中了,则认为此次访问即为由于干扰而产生的miss。PTCA为每个应用使用一个额外的tag存储,模仿一个cache,如果一个cache访问在cache中miss了,但是却在tag store中命中,则认为此次访问即为由于干扰而产生的miss。
STFM和MISE的主要问题在于没有考虑到由于共享cache所带来的干扰。FST和PTCA一方面有STFM的问题,另一方面,两者为了测量contention misses所带来的硬件开销太大了。
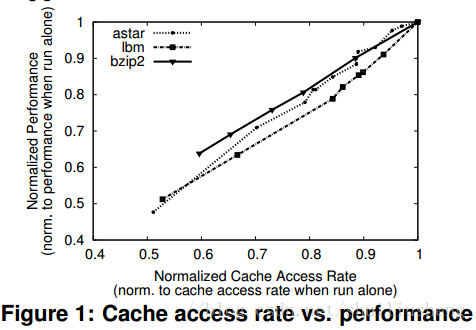
相对于MISE提出的一个现象,论文提出了“The performance of each application is proportional to the rate at which it accesses the shared cache”(应用的性能与访问共享cache的速率成正比)。实验观察的结果如图所示,实验环境为:Intel Core-i5 processor with a 6MB shared cache。
performance∝cache−access−rate(CAR)
Slowdown=performancealoneperformanceshared=CARaloneCARshared(shared更容易测量)
扫描二维码关注公众号,回复:
3177259 查看本文章

CAR(alone)的测量
Minimizing main memory interference
实现:周期性的在内存控制器中设置每个应用访存请求在很短的时间内为最高优先级,类似于MISE模型的做法。
结果:1) 消除了大部分的由于主存争用而带给CAR(alone)测量时所带来的负面影响
2) 为ASM提供了准确的cache未命中时的服务时间的估计
Quantifying shared cache interference
实现:1) 首先为每个应用增设额外的tag store来识别 contention misses(竞争缺失)
2) 利用tag store来确定竞争缺失的数量,结合平均cache未命中的服务时间和平均的cache命中的服务时间来估算为了服务contention misses的时间,从而也就定量的确定了共享cache的干扰
因为应用程序的每个执行阶段都有不一样的特征,因此ASM将执行分为多个阶段,每个阶段时间长度为Q cycles。在每一个阶段的结束时测量shared和alone情况下的CAR,给出应用slowdown的报告
Cache−Access−Rateshared=#Shared−Cache−AccessesQCARalone=#Requests during application′s epochsTime to serve requests when run alone=epoch hits+epoch missed(epoch count∗E)−epoch excess cycles
epoch excess cycles=(#Contention Misses)∗(avg miss time−avg hit time)
#Contention Misses=(epoch ATS hits)−(epoch hits)avg−miss−time=epoch miss timeepoch missesavg−hit−time=epoch hit timeepoch hits
epoch count∗E:在设置优先级之后应用程序实际运行时间epoch excess cycles:应用为了解决contentionmisses而花费的时间avg miss time:平均的cache缺失服务时间epoch count:分配给应用程序的epoch的个数epoch hits:在分配的epoch中,应用程序总的cache命中次数epoch ATS hits:应用程序在分配的epoch中,额外的tagstore中命中的次数
模型中存在的内存访问队列的延迟问题:尽管当前应用在这个时间片段内request的优先级最高,但是如果应用的request非常少,内存控制器会处理其它应用的request。当该应用需要执行内存访问的request时,就需要在请求队列中等待。因此在计算CAR(alone)的时候就需要考虑这个延迟的影响
avg queueing delay=#queueing cyclesepoch missesCARalone=epoch hits+epoch missed(epoch count∗E)−epoch excess cycles−(epoch ATS misses∗avg queueing delay)
queueing cycles:指的是应用在时间片内,应用的访存请求由于MC服务其它应用的request所等待的始终周期数
为了减少每个应用的辅助tag store的硬件开销,最终实现使用了sampling的技术。此时epoch-ATS-hits和misses的计算将发生改变。Ats_hit_fraction指的是在设置了采样之后的tag store上的命中的次数占总的次数的比例
epoch ATS hits=(ats hit fraction)∗(epoch accesses)epoch ATS misses=(ats miss fraction)∗(epoch accesses)epoch accesses=epoch hits+epoch missesats hit fraction=ats hitsats hits+ats misses
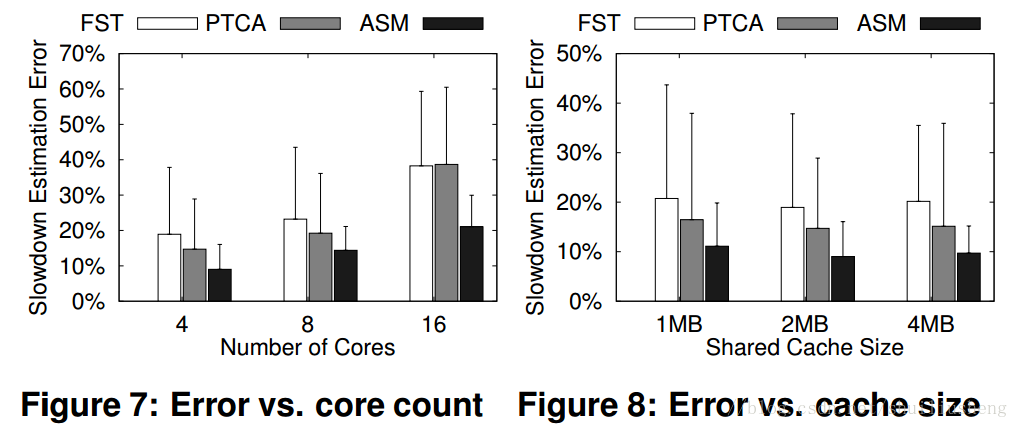
ASM的结果:在大多数的spec2006的测试集上,ASM的slowdown的错误率均比FST和PTCA低。但是ASM也存在随着CPU的核个数越多,三个模型的错误率都随着提升,但是shared cache的大小对此却没有太大的影响
ASM的showdown结果的应用
cache partition
主要思想:通过减速比的计算,给由于增加了cache大小而使得减速比下降最多的应用分配更多的cache资源
Memory Bandwidth Partitioning
主要思想:应用减速比越大获得的带宽应该越多
Ai=showdown(Ai)∑kslowdown(Ak)
Job Migration and Admission Control
Fair Pricing in Cloud Systems