golang 提供的 pprof 工具可以很方便的分析性能上的问题比如cpu的使用情况,堆内存分配,goroutine 死锁情况等
昨天使用了net/http/pprof包进行问题分析,所以简单记录一下
net/http/pprof包的使用非常简单
1、代码引入pprof
package main

import (
	"fmt"
	"github.com/valyala/fasthttp"
	"log"
	"net/http"
	_ "net/http/pprof"
	"runtime"
	"time"
)

func index(ctx *fasthttp.RequestCtx) {
	time.Sleep(200 * time.Millisecond)
	fmt.Fprintf(ctx.Response.BodyWriter(), "aaa")
}

func main() {
	runtime.GOMAXPROCS(4)

	log.Println("fasthttp")

	m := func(ctx *fasthttp.RequestCtx) {
		switch string(ctx.Path()) {
		case "/index":
			index(ctx)
		default:
			ctx.Error("not found", fasthttp.StatusNotFound)
		}
	}
	go func() {
		http.ListenAndServe("0.0.0.0:8899", nil)
	}()
	fasthttp.ListenAndServe(":8083", m)

}
以上代码import 了net/http/pprof包进行包初始化,main 函数中开启一个goroutine用来启动pprof 的web服务
PS:请自动忽略其他代码~~~:(
运行后可以访问 http://127.0.0.1:8899/debug/pprof/
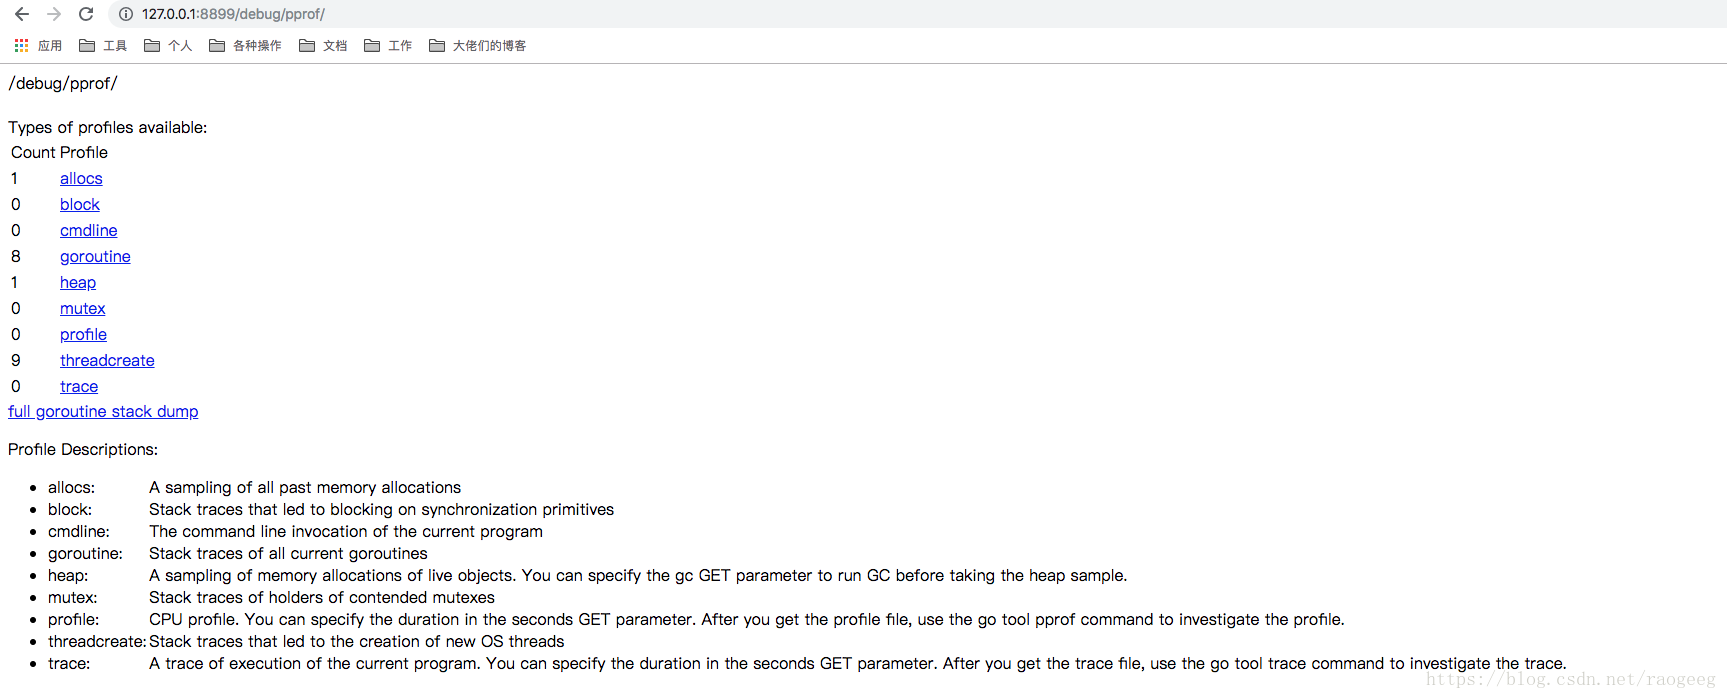
可以进入不同的子页面进行查看相关的数据
如果这样不直观还可以通过命令生成图形化的报告
安装graphviz
brew install graphviz(linux 和 win下 自行百度吧)
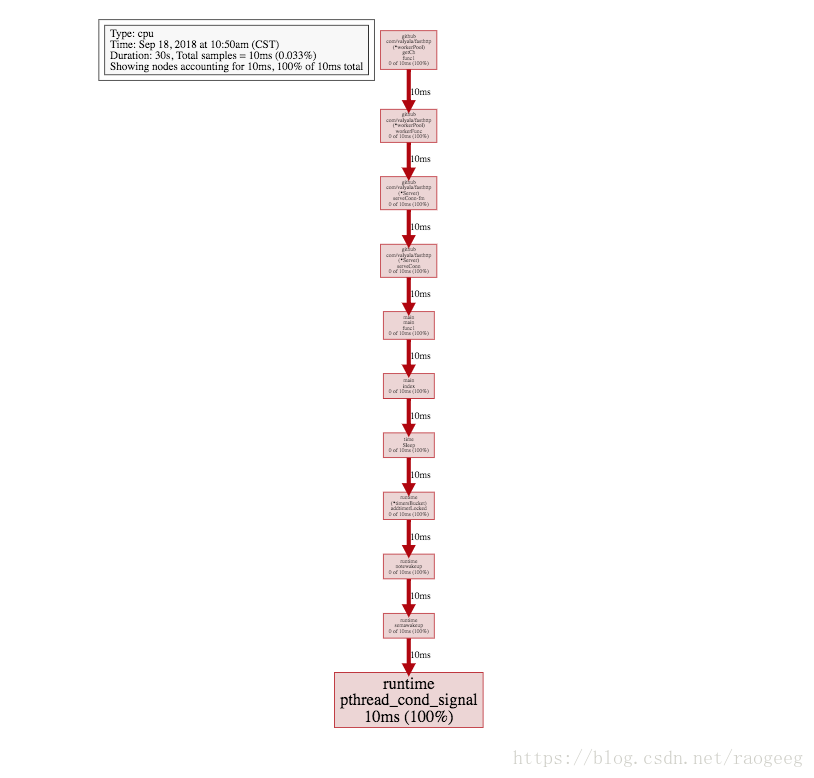
1、查看运行时cpu 的情况
go tool pprof http://127.0.0.1:8899/debug/pprof/profile
会进入30 秒的数据收集时间结束后再程序中输入web命令会自动使用打开浏览器查看生成好的报告
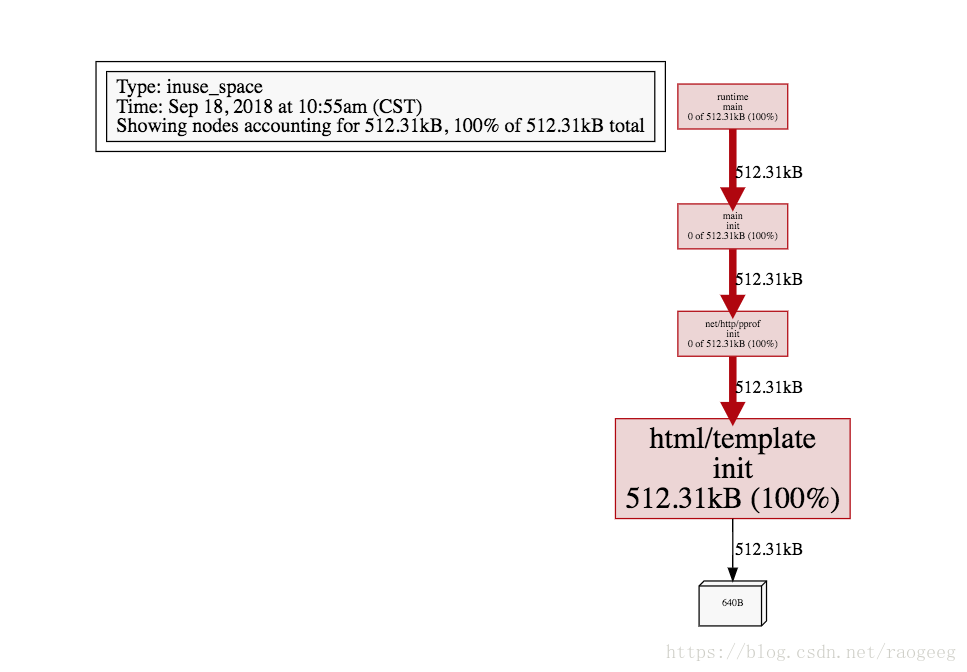
2、查看运行时堆内存分配的的情况
go tool pprof http://127.0.0.1:8899/debug/pprof/heap
输入web也一样会打开浏览器查看报告
可以非常方便的看到调用栈函数的内存使用情况
除了web命令也可以使用top命令进行查看,还支持更多的命令,不过暂时还没用到