版权声明:本文为博主原创文章,未经博主允许不得转载。 https://blog.csdn.net/aaa958099161/article/details/80672618
matplotlib画图
1点分布图
import numpy as np
import matplotlib.pyplot as plt
#数据
x_num=np.array(np.arange(15))
y_num=10*x_num+20*np.random.random(15)
fig = plt.figure()
# 画图(点图)
# fig, ax = plt.subplots()

ax = fig.add_subplot(3,2,1)
ax.scatter(x_num, y_num)
ax.set_xlabel('x')
ax.set_ylabel(' y')
plt.show()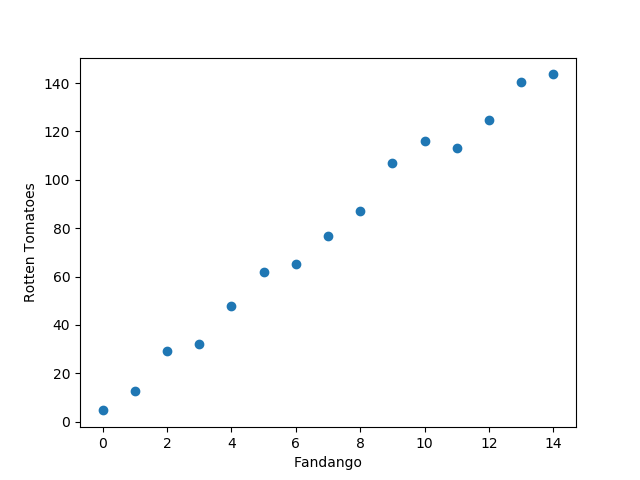
2折线图
import numpy as np
import matplotlib.pyplot as plt
#数据
x_num=np.array(np.arange(15))
y_num=10*x_num+20*np.random.random(15)
fig = plt.figure()
# 画图(点图)
# fig, ax = plt.subplots()

ax = fig.add_subplot(3,2,1)
ax.plot(x_num, y_num)
ax.set_xlabel('x')
ax.set_ylabel(' y')
plt.show()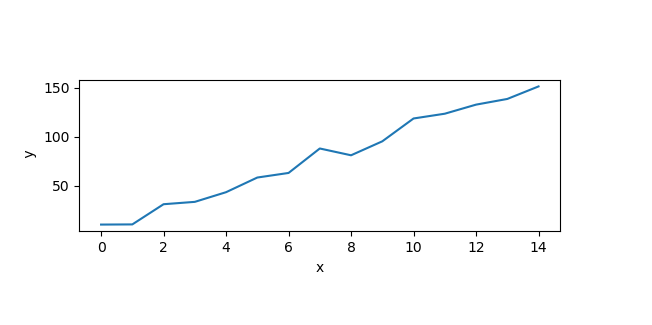
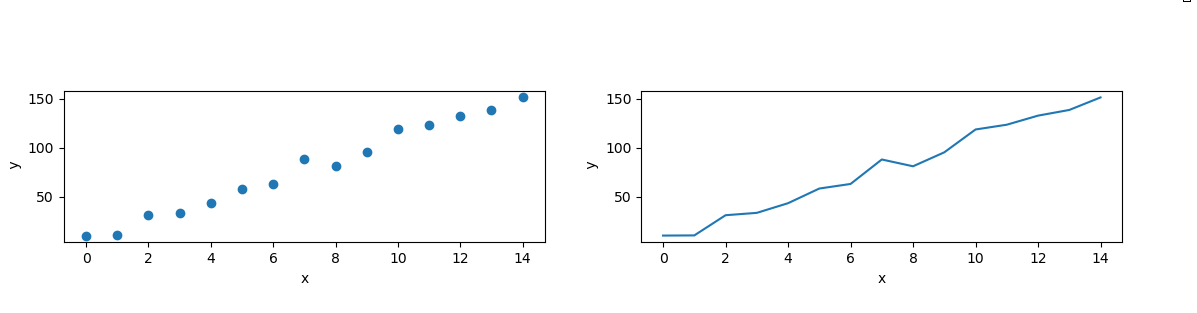
3画多个图
#coding=utf-8
'''
Created on 2018年6月12日

@author: lzs

'''
import numpy as np
import matplotlib.pyplot as plt
#数据
x_num=np.array(np.arange(15))
y_num=10*x_num+20*np.random.random(15)


fig = plt.figure()
ax = fig.add_subplot(3,2,1)
ax1 = fig.add_subplot(3,2,2)

# 画图(点图)
# fig, ax = plt.subplots()

# ax
ax.scatter(x_num, y_num)
ax.set_xlabel('x')
ax.set_ylabel(' y')
# ax1
ax1.plot(x_num, y_num)
ax1.set_xlabel('x')
ax1.set_ylabel(' y')

plt.show()