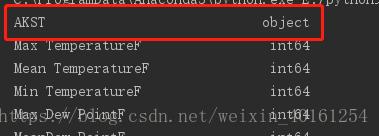
import pandas as pd
from matplotlib import pyplot as plt
from datetime import datetime
filename='sitka_weather_2014.csv'


#AKST
df=pd.read_csv(filename)

print(df.dtypes)
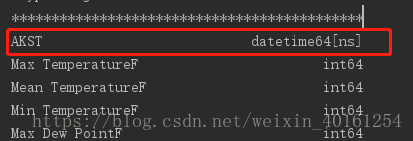
df['AKST'] = pd.to_datetime(df['AKST'], format ='%Y-%m-%d')
print('*'*44)
print(df.dtypes)
df['AKST'] =df['AKST'].apply(lambda x: x.strftime('%Y-%m-%d'))
print('*'*44)
print(df.dtypes)
