tmp
FPM:
https://github.com/jordansissel/fpm
The goal of FPM is to be able to easily build platform-native packages.
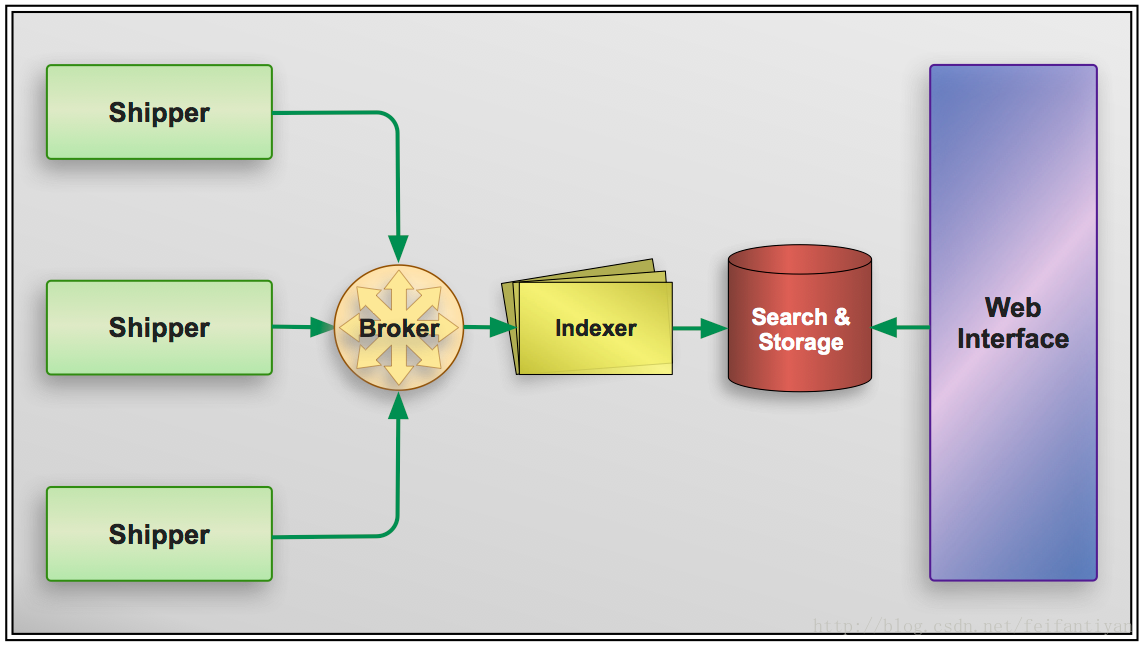
核心4组件
- Shipper: sends events to Logstash –> remote agent…
- Broker and Indexer: receive and index the events
- Search and Storeage: search and store event –> ES
- Web Interface: kibana
broker(Redis):
As this is our central server we’re going to install a broker for Logstash. The broker receives events from our shippers and holds them briefly prior to Logstash indexing them. It essentially acts as a “buffer” between your Logstash agents and your central server.
- It is a way to enhance the performance of your Logstash environment by providing a caching buffer for log events.
- It provides some resiliency in our Logstash environment. If our Logstash indexing fails then our events will be queued in Redis rather than potentially lost.
To learn how to:
- Install and deploy Logstash.
- Ship events from a Logstash Shipper to a central Logstash server.
- Filter incoming events using a variety of techniques.
- Output those events to a selection of useful destinations.
- Use Logstash’s Kibana web interface.
- Scale out your Logstash implementation as your environment grows.
- Quickly and easily extend Logstash to deliver additional functionality you might need.
Ref:
- 官方:https://www.elastic.co/products/logstash
- Logstash 5.6.0 released Modules contain pre-packaged Logstash pipelines, Kibana dashboards and other metadata files to ease the set up of the Elastic Stack for certain data sources.
- doc https://www.elastic.co/guide/en/logstash/5.6/logstash-modules.html
3种 plugin components
- inputs - How events get into Logstash.
- filters - How you can manipulate events in Logstash.
- outputs - How you can output events from Logstash.
codecs:
- plain
- json
plugins
input plugins
- File input plugin: https://www.elastic.co/guide/en/logstash/current/plugins-inputs-file.html
- sincedb , ~/ ,
- sincedb_path , must be used for each input. Using the same path will cause issues.
- Beats input plugin https://www.elastic.co/guide/en/logstash/current/plugins-inputs-beats.html
- Elasticsearch input plugin
- Exec input plugin
- Heartbeat input plugin
- Http input plugin: URL监控或 定时获取响应
- Http_poller input plugin: GET springboot metrics endpoint, instead of configuring jmx to monitor my java application memory/gc/ etc.
- Kafka input plugin
- Redis input plugin
- Stdin input plugin
- Syslog input plugin
- Tcp input plugin
- Udp input plugin
- Websocket input plugin
- Jmx input plugin
- Jms input plugin ,Read events from a Jms Broker. Supports both Jms Queues and Topics.
- Unix input plugin ,over a UNIX socket.
- Syslog input plugin
- RSyslog ,indeed it has become the default Syslog daemon
- http://www.rsyslog.com/doc/
- /etc/init.d/rsyslog status
- imfile module , transmit the contents of files on the host via Syslog. supports file rotation and tracks the currently processed entry in the file.
- Syslog-NG
- Syslogd
- RSyslog ,indeed it has become the default Syslog daemon
input without Logstash Agent
Syslog daemons
support logging from a variety of platforms and applications. It has become the default mechanism for logging on Unix and Unix-like systems like Linux and is heavily used by applications running on these platforms
https://en.wikipedia.org/wiki/Syslog
Filter plugins
- Grok filter plugin https://www.elastic.co/guide/en/logstash/current/plugins-filters-grok.html
Drop filter plugin , drops events when a specific regular expression match
Working with Filebeat Modules https://www.elastic.co/guide/en/logstash/current/filebeat-modules.html
Using the Logstash Forwarder
- cann’t use Logstash Agent , –> Memory
- Syslog isn’t an option
The Logstash Forwarder (here after Forwarder) is designed to be a lightweight client and server for sending messages to Logstash.It includes a custom-designed protocol and unlike any of our previous transports it also includes some security via SSL encryption of the traffic as well as compression of log traffic.
The Forwarder is designed to be tiny, incredibly memory conservative and very, very fast.
1 Filtering Events
if [type] == "tomcat" and [message] !~ /(.+)/ {
   drop { }
}

if "security" in [tags] {
    grok {
        . . .
    }
}

if [type] == "apache" {...
} else if [type] != "tomcat" {...
} else {...}
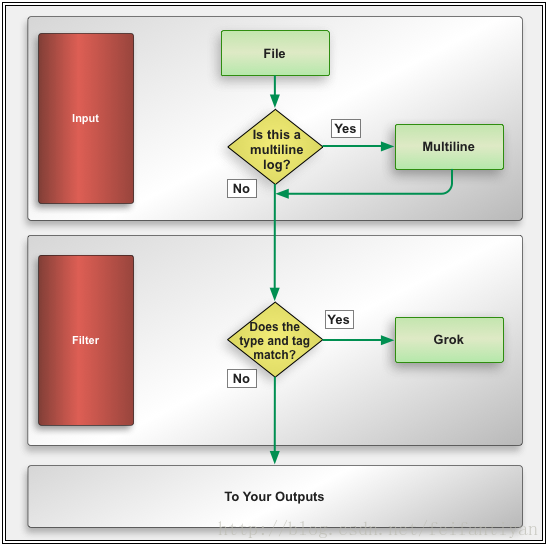
1.2 Handling multi-line log events
Java exception stack traces:
These are multi-line events but currently Logstash is parsing each line as a separate event.
To do this we’re going to build some simple regular expression patterns combined with a special codec called multiline . Codecs are used inside other plugins to handle specific formats or codecs.
file {
    type => "tomcat"
    path => [ "/var/log/tomcat6/catalina.out" ]
    codec => multiline {
        pattern => "(^\d+\serror)|(^.+Exception: .+)|(^\s+at .+)|(^\s+... \d+ more)|(^\s*Caused by:.+)"
        what => "previous"
    }
}
| , or
If the line matches any one of the regular expressions, Logstash will then merge this event with either the previous or next event.In the case of our stack traces we know we want to merge the event with the event prior to it — by
whatoption.NOTE Any event that gets merged will also have a tag added to it. By default this tag is multiline but you can customize this using the multiline_tag option of the codec.
1.3 Grokking our Java events
Handily there’s a built-in set of patterns for Java events so let’s build a grok filter that uses them:
if [type] == "tomcat" and "multiline" in [tags] {
    grok {
        match => [ "message", "%{JAVASTACKTRACEPART}" ]
    }
}
we’ve added some useful fields with which to search or identify specific problem pieces of code.
TIP:All the filters in Logstash currently executes as a
workermodel. Each worker receives an event and applies all filters, in order, before sending that event to the output plugins. If you are doing intensive filtering or discover that filtering is a bottleneck in your environment you can add additional workers by starting Logstash with the-wflag. You can specify the number of workers you wish to run, for example for 5 workers specify-w 5.
1.4 Parsing an in-house custom log format
input {
    file {
        type => "alpha"
        path => ["/opt/alpha/logs/alpha.log"]
        tags => [ "alpha", "finance" ]
    }
}
1388290083+0200 The Alpha server has terminated /opt/alpha/server/ start.vb#134 ALF13-36B AlphaApp/2.4.5a/QA Release
- The timestamp.
- The log message.
- The ID of the message.
- The file and line number that generated the error.
- The name of the application.
- The version of the application.
- The release of the application.
- They also want to have a field called environment created and set to QA if the application is a QA release.
To extract the data we need in our Grok filter we’re going to use a mix of inbuilt patterns and the named capture capability.
named captures
specify a field name and a regular expressions to extract that field from the log entry.
regular expression tools:
- Rubular: http://rubular.com
- Grok debugger: http://grokdebug.herokuapp.com
Filter plugins :
- Date filter plugin
- Grok filter plugin
1 Scaling Logstash
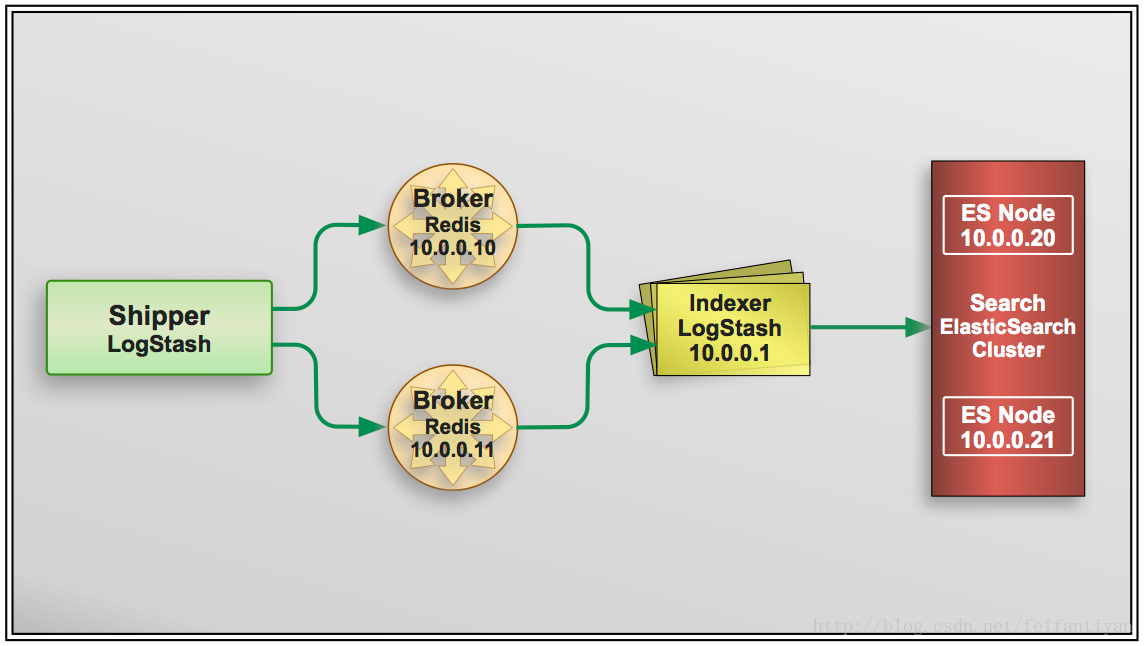
1.1 Scaling Redis( failover model )
Configuring Redis output to send to multiple Redis servers
specify multiple Redis instances in a failover model and send events to them. We’re going to configure the redis output on each of our shipping agents
output {
    redis {
        host => [ "10.0.0.10", "10.0.0.11" ]
        shuffle_hosts => true
        ...
Configuring Logstash to receive from multiple Redis servers
input {
    redis {
        host => "10.0.0.10"
        data_type => "list"
        type => "redis-input"
        key => "logstash"
    }
    redis {
        host => "10.0.0.11"
        data_type => "list"
        type => "redis-input"
        key => "logstash"
    }
}
1.2 Scaling ElasticSearch
添加集群节点即可
1.3 Scaling Logstash
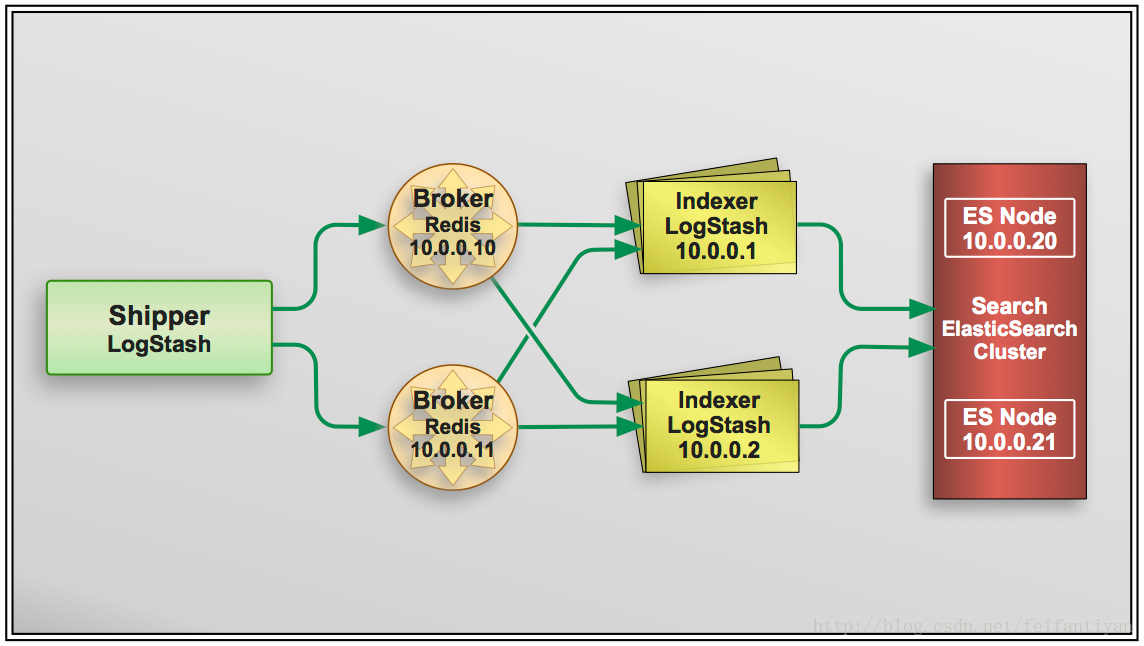
As both Logstash indexers are using the same configuration and both are listening for inputs from the same Redis brokers they will start to both process events.
Extending Logstash
- Creating our own input plugin
- Writing a filter
- Writing an output