版权声明:本文为博主原创文章,未经博主允许不得转载。 https://blog.csdn.net/qq_25027593/article/details/82454836
var getOption1 = function(chartType) {
var chartOption1 = {
calculable: false,
title: {
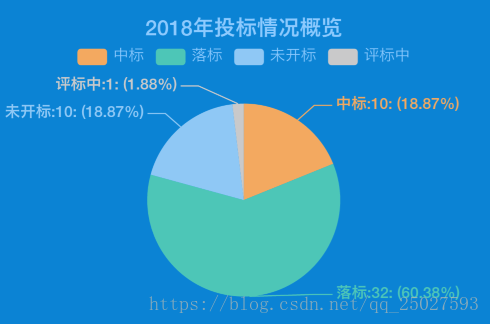
text: '2018年投标情况概览',
x: 'center',
textStyle: {
"color": "#8ECBFF"
},
},
legend: {
top: 25,
data: ['中标', '落标', '未开标', '评标中'],
textStyle: { //图例文字的样式
color: '#8ECBFF',
fontSize: 13
}
},
series: [{
type: 'pie',
radius: '65%',
center: ['50%', '63%'],
label: { //饼图图形上的文本标签
normal: {
show: true,
textStyle: {
fontWeight: 700,
fontSize: 13 //文字的字体大小
},
formatter: '{b}:{c}: ({d}%)',
}
},
data: [{
value: 10,
name: '中标',
itemStyle: {
normal: {
color: '#F4AA61'
}
}
}, {
value: 32,
name: '落标',
itemStyle: {
normal: {
color: '#4EC7B8'
}
}
}, {
value: 10,
name: '未开标',
itemStyle: {
normal: {
color: '#90C9F6'
}
}
}, {
value: 1,
name: '评标中',
itemStyle: {
normal: {
color: '#CACACB'
}
}
}]
}]
}
return chartOption1;
};怎么使用参考另一篇柱状图文章。
效果图: