版权声明:未经本人同意不得转载! https://blog.csdn.net/yanpenggong/article/details/82730285
关于python引用matplotlib作图的时候,中文标注无法正常显示,乱码为小方框
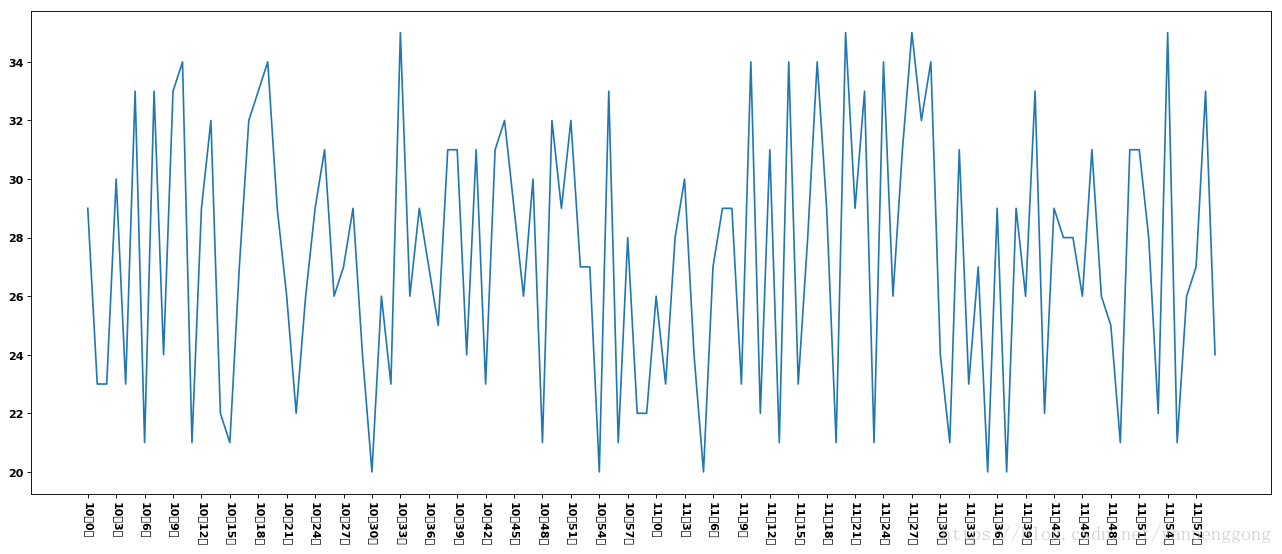
通常在作图的时候,没有设置字体以为是默认字体,但是这里会追踪不到字体的位置,运行下面的代码,出现的图会出现不能显示中文的异常
from matplotlib import pyplot as plt
import random

x = range(0,120)
y = [random.randint(20,35) for i in range(120)]

plt.figure(figsize=(20,8), dpi=80)

plt.plot(x,y)

x_label =list(x)
x_label_show = ["10点{}分".format(i) for i in range(60)]
x_label_show += ["11点{}分".format(i-60) for i in range(60,120)]
plt.xticks(x_label[::3],x_label_show[::3],rotation=-90)  # rotation旋转的度数
plt.show()
图像的结果:
解决办法:
代码中添加如下信息
# windows 和linux设置字体的方法
# import matplotlib

# font = {'family' : 'MicroSoft YaHei',
#         'weight' : 'bold',
#         'size'   : 10}
# matplotlib.rc("font", **font)

# 通用字体设置
from matplotlib import font_manager

# my_font = font_manager.FontProperties(fname="字体的本地完整路径")
my_font = font_manager.FontProperties(fname="/Library/Fonts/Songti.ttc")
......
plt.xticks(......, fontproperties=my_font)  # rotation旋转的度数
实例完整代码如下:
from matplotlib import pyplot as plt
import random


# windows 和linux设置字体的方法
# import matplotlib

# font = {'family' : 'MicroSoft YaHei',
#         'weight' : 'bold',
#         'size'   : 10}
# matplotlib.rc("font", **font)

# 通用字体设置
from matplotlib import font_manager
my_font = font_manager.FontProperties(fname="/Library/Fonts/Songti.ttc")


x = range(0,120)
y = [random.randint(20,35) for i in range(120)]

plt.figure(figsize=(20,8), dpi=80)

plt.plot(x,y)

x_label =list(x)
x_label_show = ["10点{}分".format(i) for i in range(60)]
x_label_show += ["11点{}分".format(i-60) for i in range(60,120)]
plt.xticks(x_label[::3],x_label_show[::3],rotation=-90, fontproperties=my_font)  # rotation旋转的度数
plt.show()
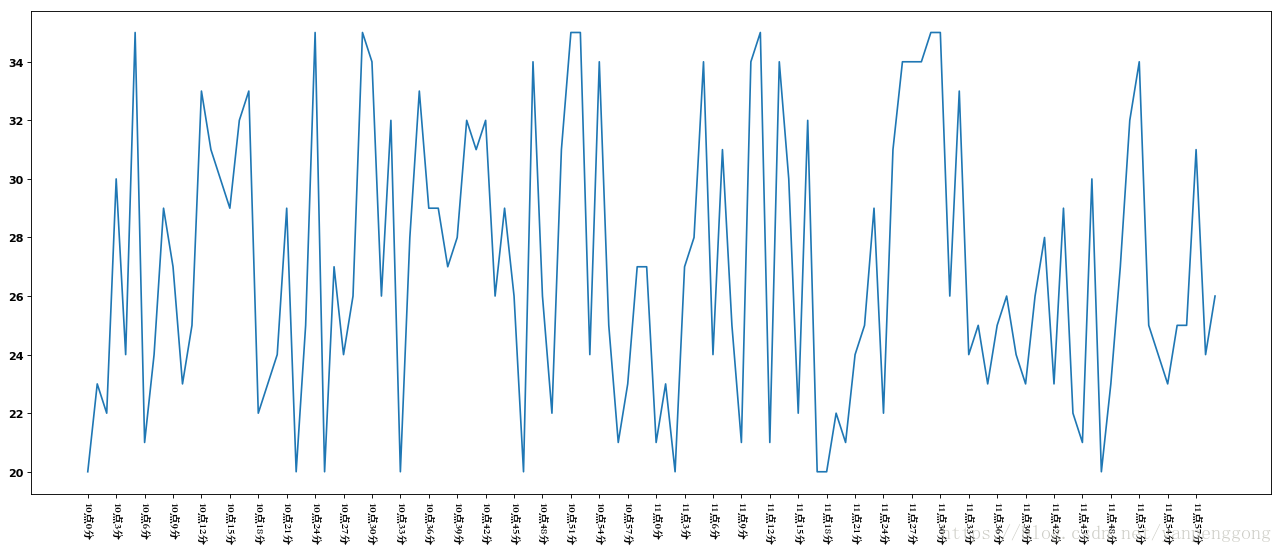
实例效果:
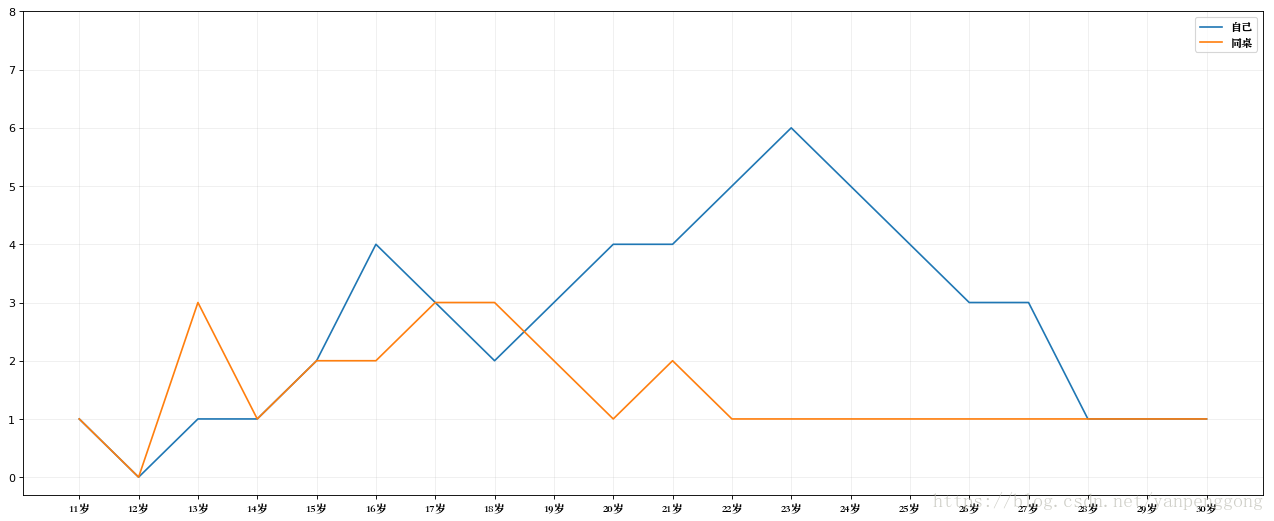
另外,遇到图例p l t.legend()要展示中文的时候,此时得换用方法plt.legend(prop=my_font)
实例:
# 统计从11岁到30岁每年交的男(女)朋友数量
from matplotlib import pyplot as plt
from matplotlib import font_manager

y_0 = [1,0,1,1,2,4,3,2,3,4,4,5,6,5,4,3,3,1,1,1]
y_1 = [1,0,3,1,2,2,3,3,2,1,2,1,1,1,1,1,1,1,1,1]

x=range(11,31)

my_font = font_manager.FontProperties(fname="/Library/Fonts/Songti.ttc")

# 设置图形大小
plt.figure(figsize=(20,8),dpi=80)
plt.plot(x,y_0,label="自己")
plt.plot(x,y_1,label="同桌")

# 设置x轴刻度
xtick_labels = ["{}岁".format(i) for i in x]
plt.xticks(x,xtick_labels,fontproperties=my_font)
plt.yticks(range(0,9))

# 绘制网格
plt.grid(alpha=0.2)  # alpha 透明度

# 添加图例
plt.legend(prop=my_font, loc="upper right")  # prop:设置字体; loc:设置展示的位置,upper left 左对齐,upper right 右对齐


# 展示
plt.show()
搞定~