Python——使用matplotlib绘制柱状图
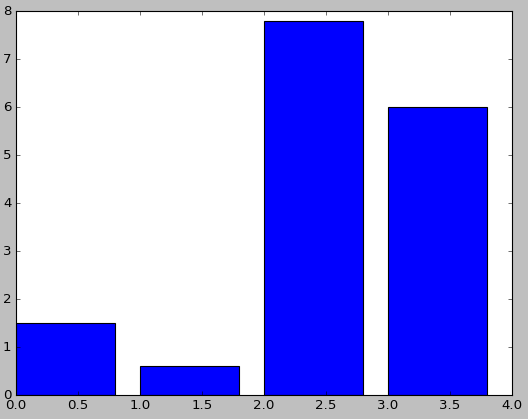
转载自:https://blog.csdn.net/qq_29721419/article/details/716389121、基本柱状图
首先要安装matplotlib(http://matplotlib.org/api/pyplot_api.html#matplotlib.pyplot.plot) 可以使用pip命令直接安装
-
# -*- coding: utf-8 -*-
-
import matplotlib.pyplot
as plt
-
-
num_list = [
1.5,
0.6,
7.8,
6]
-
plt.bar(range(len(num_list)), num_list)
-
plt.show()
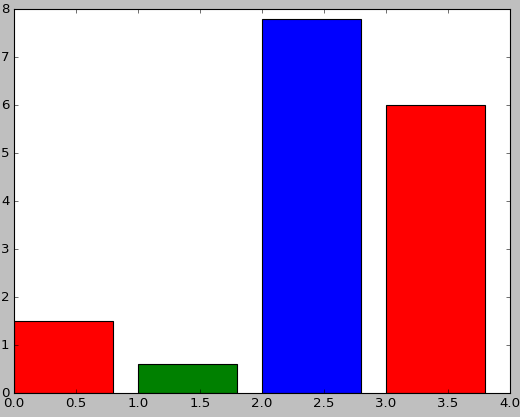
2、设置颜色
-
# -*- coding: utf-8 -*-
-
import matplotlib.pyplot
as plt
-
-
num_list = [
1.5,
0.6,
7.8,
6]
-
plt.bar(range(len(num_list)), num_list,fc=
‘r’)
-
plt.show()

-
# -*- coding: utf
-8 -*-
-
import matplotlib.pyplot as plt
-
-
num_list = [
1.5,
0.6,
7.8,
6]
-
plt.bar(range(len(num_list)), num_list,color=
‘rgb’)
-
plt.show()
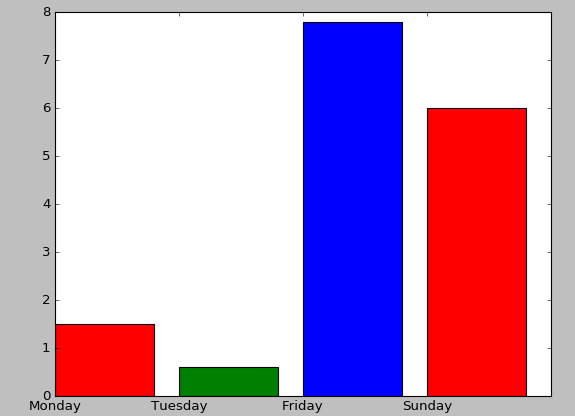
3、设置标签
-
# -*- coding: utf-8 -*-
-
import matplotlib.pyplot
as plt
-
-
name_list = [
‘Monday’,
‘Tuesday’,
‘Friday’,
‘Sunday’]
-
num_list = [
1.5,
0.6,
7.8,
6]
-
plt.bar(range(len(num_list)), num_list,color=
‘rgb’,tick_label=name_list)
-
plt.show()
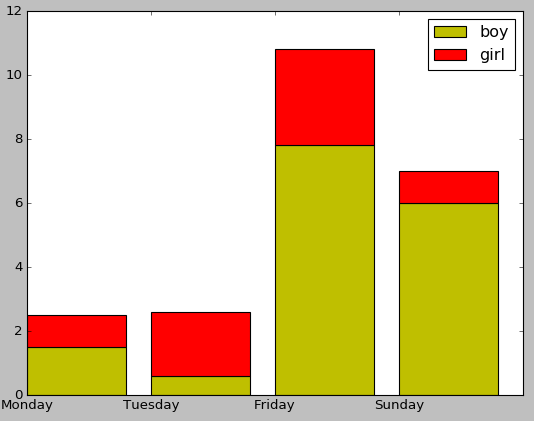
4、堆叠柱状图
-
# -*- coding: utf-8 -*-
-
import matplotlib.pyplot
as plt
-
-
name_list = [
‘Monday’,
‘Tuesday’,
‘Friday’,
‘Sunday’]
-
num_list = [
1.5,
0.6,
7.8,
6]
-
num_list1 = [
1,
2,
3,
1]
-
plt.bar(range(len(num_list)), num_list, label=
‘boy’,fc =
‘y’)
-
plt.bar(range(len(num_list)), num_list1, bottom=num_list, label=
‘girl’,tick_label = name_list,fc =
‘r’)
-
plt.legend()
-
plt.show()
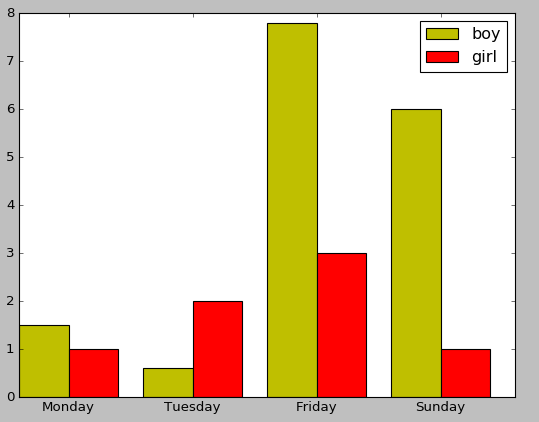
5、并列柱状图
-
# -*- coding: utf-8 -*-
-
import matplotlib.pyplot
as plt
-
-
name_list = [
‘Monday’,
‘Tuesday’,
‘Friday’,
‘Sunday’]
-
num_list = [
1.5,
0.6,
7.8,
6]
-
num_list1 = [
1,
2,
3,
1]
-
x =list(range(len(num_list)))
-
total_width, n =
0.8,
2
-
width = total_width / n
-
-
plt.bar(x, num_list, width=width, label=
‘boy’,fc =
‘y’)
-
for i
in range(len(x)):
-
x[i] = x[i] + width
-
plt.bar(x, num_list1, width=width, label=
‘girl’,tick_label = name_list,fc =
‘r’)
-
plt.legend()
-
plt.show()
6、条形柱状图
-
# -*- coding: utf-8 -*-
-
import matplotlib.pyplot
as plt
-
-
name_list = [
‘Monday’,
‘Tuesday’,
‘Friday’,
‘Sunday’]
-
num_list = [
1.5,
0.6,
7.8,
6]
-
plt.barh(range(len(num_list)), num_list,tick_label = name_list)
-
plt.show()
