Hystrix-dashboard是一款针对Hystrix进行实时监控的工具,通过Hystrix Dashboard我们可以在直观地看到各Hystrix Command的请求响应时间, 请求成功率等数据。
添加如下依赖
        <dependency>
            <groupId>org.springframework.cloud</groupId>
            <artifactId>spring-cloud-starter-netflix-hystrix-dashboard</artifactId>
        </dependency>
        <dependency>
            <groupId>org.springframework.boot</groupId>
            <artifactId>spring-boot-starter-actuator</artifactId>
        </dependency>
启动类加上@EnableHystrixDashboard注解
开启暴露接口(这个是配置在有@HystrixCommand注解的项目里)
#/actuator/hystrix.stream
management.endpoints.web.exposure.include=*访问http://localhost:8082/hystrix
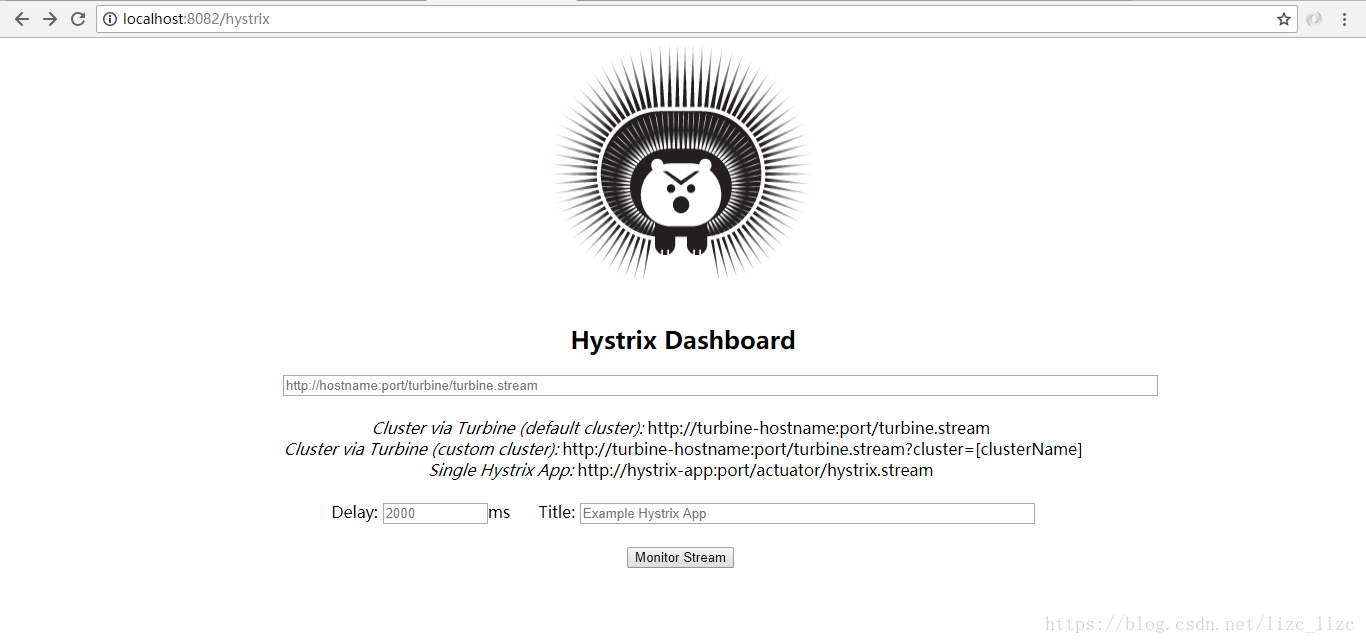
输入ip:port/actuator/hystrix.stream 上下都显示loading 就说明连接上了
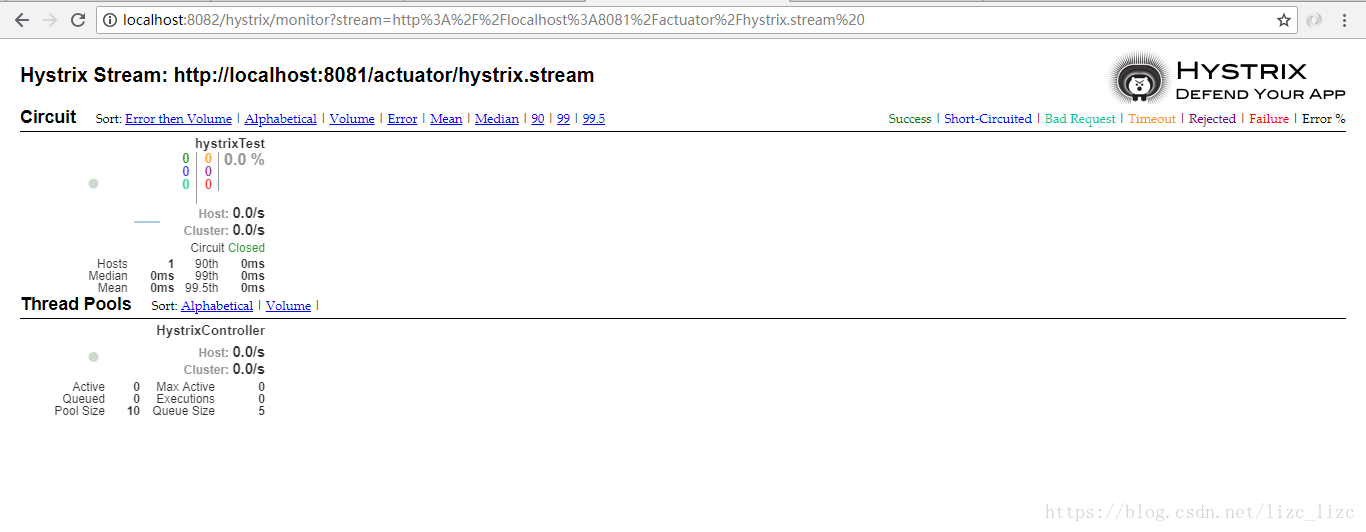
访问被@HystrixCommand注解的方法,就能看到统计