From a programming point of view, let's say that we can only use this drand48() function which we know has a uniform
probability distribution (however in C++11, the latest C++ standard, you can now find random number generators with various
probability distribution functions, including a normal distribution but for the sake(目的) of this exercise we won't be using those).
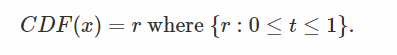
If you remember what we said about CDF, the function goes from 0 to 1 and is monotonically(单调) increasing. Since we can
only generate number between 0 and 1 with equal probability, what we could do, is draw a number using drand48() and look at
it as being(把...看待) the result of the CDF. If you look at figure 1 which illustrates this idea, it must be clear that(必须清楚的
是) the probability of sampling any of the cubes making up the column is equal. Each cube has equal probability to be chosen
and any position on each one of these cubes has equal probability to be chosen as well. Thus using a random variable with
uniform distribution to pick a point anywhere along the Y axis between 0 and 1 makes sense. If we say that r is the result of
drand48() for example (in literature(文学), random numbers with uniform distribution are often denoted with the Greek letter
epsilon ϵ), we could write:

(从[0,1]的均匀分布里面去采样一个sample,这个sample看作是CDF(X)的结果(r),这个X是一个随机变量,是来自PDF的随机变量)
The idea is to see the result of our uniformly distributed random generator as the result of the CDF for some value of x (which
we don't know). But why is it interesting to look at the problem this way? Because, if we somehow(以某种方式) could manage
to invert the CDF, in other words find a function such that:
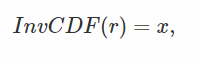
we would actually have a way of drawing random numbers (the x's) with any PDF we want (since the CDF is directly derived
from the PDF), by simply drawing random number uniformly distributed between 0 and 1 (which is a thing we can easily do with
functions such as drand48()). This, in essence(本质上), is the principle of the Inverse Transform Sampling Method.
(我们实际上有一个 采样 任何 PDF 的值 的方式(x值),主要是均匀随机采样[0,1],把采样到的值传入 inv CDF 中,这样就可以用均匀采样来实现 采样 PDF的值。)

Let's see how this works with our example. In figure 2, we plotted the CDF of the standard normal distribution function (this PDF
defines the probability that our train arrives within a certain time of the scheduled arrival time). As we know, the CDF converges
to 1. We can interpret(解析) the Y axis of this graph, as the result of our random number generator with uniform
distribution. Now, if we invert that graph (you can see the resulting graph at the bottom of figure 2), we get another graph in
which the X axis varies from 0 to 1 (previously Y in the top figure), and in which the Y axis varies from -5 to 5 (previous X in the
top figure). We inverted the CDF. If we then randomly chose a value for X between 0 and 1 (using drand48() for instance), what
we get when we read the result of that function (in blue) for that value of X, is some random value (a value along the Y axis)
representing the time difference between the time the train shall arrive, and the time it is scheduled to arrive. Again, the Y value is random since the X value is random:
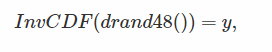
where y is a random number drawn from a "random number generator" with the PDF of interest. Which is what we wanted for
our train simulation.
Spend some time(花一些时间) actually looking at the graph, and try to see what happens for various values of X. In fact, you
can see that the invert of the CDF for the normal distribution varies very little for small values of X (between 0 and 0.05) and
value of X close to 1 (between 0.95 and 1).However since the values of X are chosen randomly and uniformly, it means that this
function is more likely to return values between [-2,-1.5] and [1.5,2] than between [-5,-2] or [2,5]. Which is what we want, since
we know by just looking at the PDF, that trains are more likely to arrive with a 1 or 2 minutes difference than with 3 or 4 or
5 (see in figure 4, the arrow with the annotation(注释) "time more likely to be chosen within that range").
(个人理解,在上面的图可以看到,蓝色曲线可以看出, x从[0.05, 0.95]对应的都是y的[-1.5,1.5], 因为x是均匀随机采样的,那就是,采样x的得到的y在[-1.5,1.5]区间的可能性更加高)
To summarize, to pick up a random value for our train simulation using a random variable with a given PDF, we need:
- the PDF of the random variable X we want to simulate (the normal standard distribution function in our train example but it could be any other arbitray PDF),
- to create a CDF from this PDF (using for instance a Riemann sum(黎曼和)),
- to invert that CDF (we will show how next),
- to draw an "auxiliary"(辅助) random number ϵ with uniform distribution,
- get y from the invert CDF for that value of ϵ:
- the resulting value y is a random number drawn from a random variable X with the desired PDF.