版权声明:转载请声明出处,谢谢! https://blog.csdn.net/qq_31468321/article/details/84350499
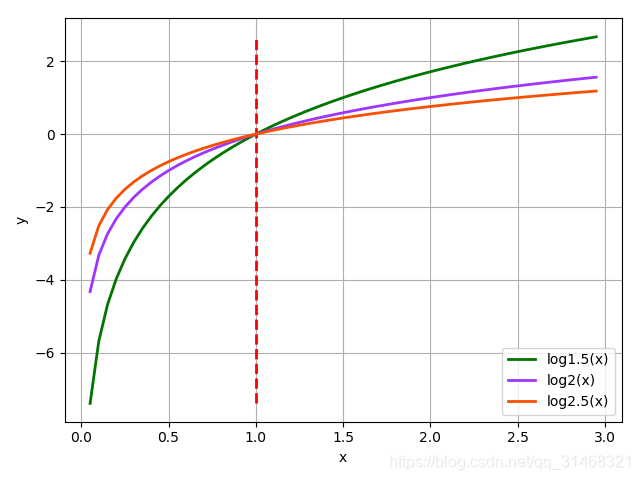
本文分析log函数在不同底的情况下,图像趋势的变化
分别画出三个不同底数的log函数图像进行展示
- log1.5(x)
- log2(x)
- log2.5(x)
代码展示
def log_change():
   #得到底数
    x = np.arange(0.05,3,0.05)
    #计算对应的Y值
    y1 = [math.log(a,1.5) for a in x]
    #作图
    plt.plot(x,y1,linewidth=2,color='#007500',label='log1.5(x)')
    #画出x=1的线
    plt.plot([1,1],[y1[0],y1[-1]],'r--',linewidth=2)
    y2 = [math.log(a, 2) for a in x]
    y3 = [math.log(a, 2.5) for a in x]
    plt.plot(x,y2,linewidth=2,color='#9F35FF',label='log2(x)')
    plt.plot(x,y3,linewidth=2,color='#F75000',label='log2.5(x)')
    plt.legend(loc='lower right')
    plt.grid(True)
    plt.xlabel('x')
    plt.ylabel('y')
    plt.show()
if __name__ == '__main__':
    log_change()
图像展示