作为最常用的绘图函数之一,我们要比较详细的介绍了。
matplotlib.pyplot.plot(*args, scalex=True, scaley=True, data=None, **kwargs)
API:
https://matplotlib.org/api/_as_gen/matplotlib.pyplot.plot.html
- 返回值:对应于每条线的 Line2D实例的 列表
plot y-x as lines and/or markers
调用实例:
- 绘制 单个y-x
plot([x], y, [fmt], data=None, **kwargs) - 在一个Aaxes 中绘制多个y-x
plot([x], y, [fmt], [x2], y2, [fmt2], …, **kwargs)
其中, 可选参数fmt定义图的基本形式,比如颜色,标记(x,y)点的形状,和曲线的类型[color, marker and linestyle]。
先讲一下其他的几个参数:
-
data
在绘制一些标签数据(比如,可以通过obj[‘y’]索引到的数据), 不用提供数据x,y。可以将对象名传给参数data,只需要传给x,y的标签就好。其中,所有索引的对象都支持,比如
dict, pandas.DataFrame or structed numpy array前两个参数不是参数x, y,
比如调用plt.plot(x='labelx',y= 'labely', data=data_ex)将会报错
import matplotlib.pyplot as plt
import numpy as np

data_ex = {'labelx': [1, 2, 3,4], 'labely': [1, 2, 3, 4]}

# print(data_ex['labelx'])
plt.plot('labelx', 'labely', data=data_ex)

plt.show()
- scalex, scaley: bool, optional, default: True
是否将轴的数据显示长度与x,y的数据尺度相适应。
y=range(100)
fig, axes = plt.subplots(2,1)
# print(axes.shape)
axes[0].plot(y)
axes[1].plot(y, scalex=False, scaley=False)
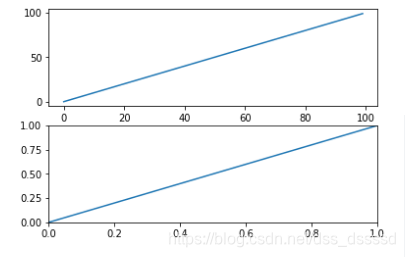
可以看出第二幅图片,x,y横轴显示的长度只到1, 此参数默认为True就好
开始画图吧
一下代码将严格按照先创建Figure, 然后创建Axes, 最后在不同的Axes上作图的顺序执行,代码可能有点繁琐, 但是更易于读懂和定制:
关于Figure和Axes的讲解:https://blog.csdn.net/dss_dssssd/article/details/84316975
在所有代码开始之前先创建数据x,y
创建:
- x: ,
- y:
x = np.linspace(-np.pi, np.pi, 128,endpoint=True)
cosx,sinx,x_3 = np.cos(x), np.sin(x), x / 3
- 绘制一个简单的图: 绘制cos(x)
fig, axes = plt.subplots()
axes.plot( cosx)

plt.show()
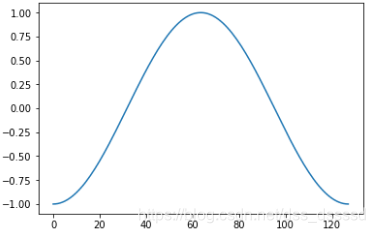
注意x是从0开始的, x为[0, 127],这是因为若只传入y,则自动计算x: range(len(y))
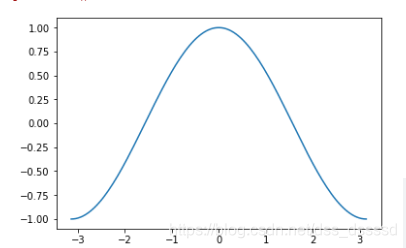
- 传入x值
fig, axes = plt.subplots()
axes.plot(x, cosx)

plt.show()
- 在一个Axes中绘制多个函数,
fig, axes = plt.subplots()
axes.plot(x, cosx, x, sinx, x, x_3)

plt.show()
