版权声明:本文为博主原创文章,未经博主允许不得转载。 https://blog.csdn.net/LRH2018/article/details/80641344
使用jupyter-notebook进行数据分析
首先需要安装jupyter notebook,打开cmd用 pip install jupyter notebook即可,然后就是下载需要的数据文件。https://pan.baidu.com/s/1Yney0puMONBUceycm4fakg放到代码目录下data文件夹里面。
使用cmd 到需要创建代码的目录下输入jupyter notebook就会跳到jupyter的页面。

点击右上的new创建新文件后就可以输入代码。按shift + Enter 可以运行

Part 1
1、Compute the mean and variance of both x and y
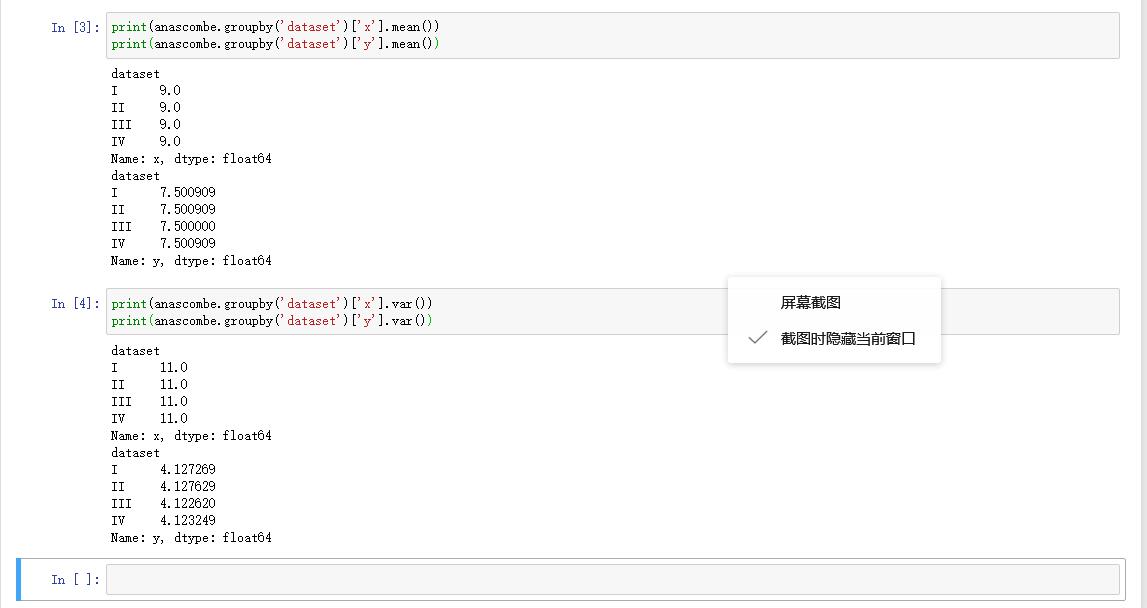
2、Compute the correlation coefficient between x and y

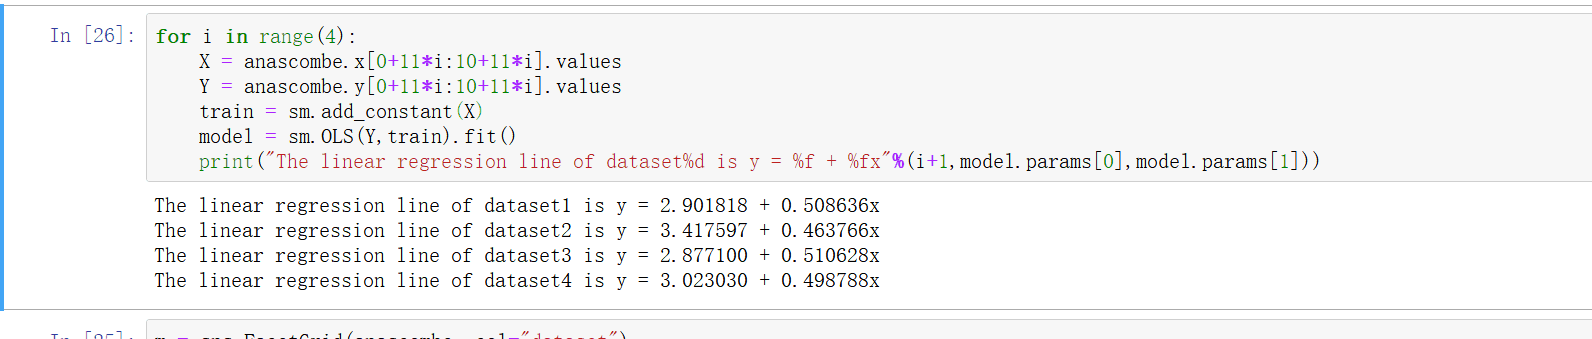
3、Compute the linear regression line:
- y=β0+β1x+ϵy=β0+β1x+ϵ (hint: use statsmodels and look at the Statsmodels notebook)
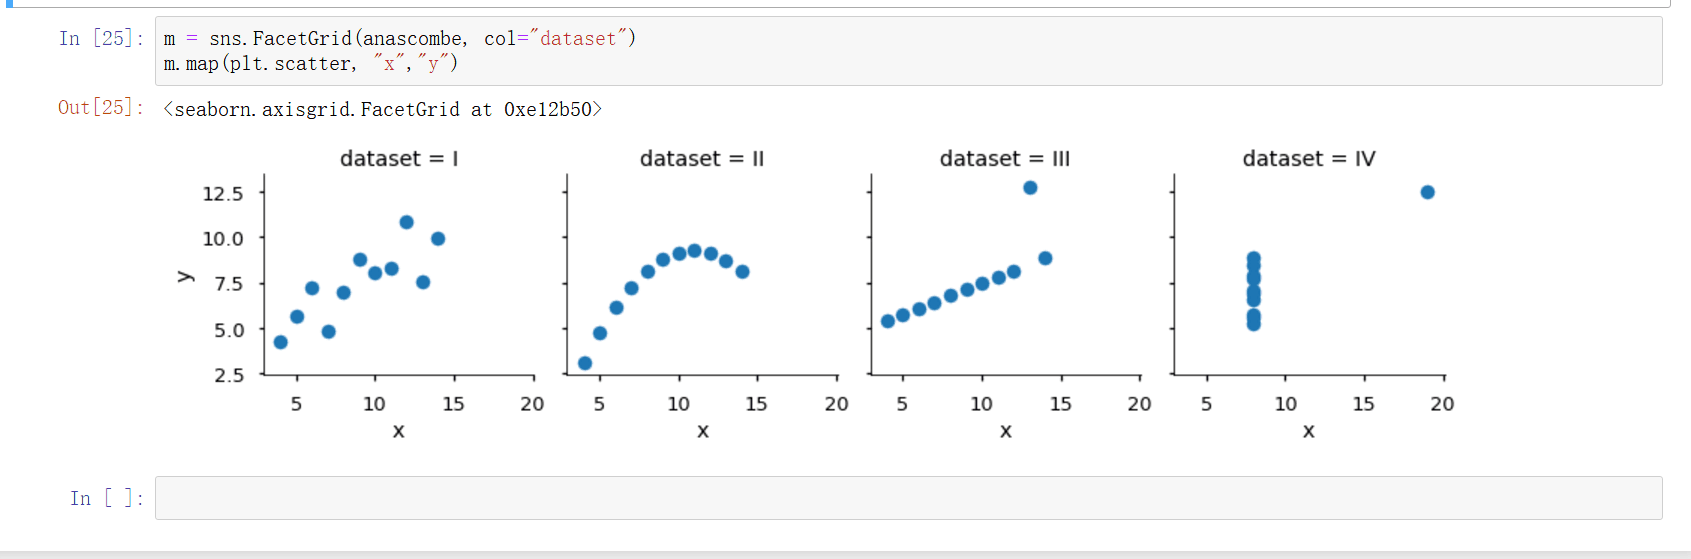
Part 2
Using Seaborn, visualize all four datasets.
hint: use sns.FacetGrid combined with plt.scatter