一个可视化库seaborn,可以与pandas数据框完美协作。seaborn是建立在matplotlib之上的,我们可以利用matplotlib所学的知识来修改并使用seaborn。
import os
import pandas as pd
import numpy as np
import seaborn as sns
import requests
import matplotlib.pyplot as plt
plt.style.use('ggplot')
%matplotlib inline
PATH = r'C:/Users/Administrator/Desktop/iris/'
r = requests.get('https://archive.ics.uci.edu/ml/machine-learning-databases/iris/iris.data')
#print(r.text)
with open(PATH + 'iris.data' , 'w') as f:
f.write(r.text)
os.chdir(PATH)
df = pd.read_csv(PATH + 'iris.data' , names = ['sepal length' , 'sepal width' , 'petal length' , 'petal width' , 'class'])
sns.pairplot(df , hue = "class")
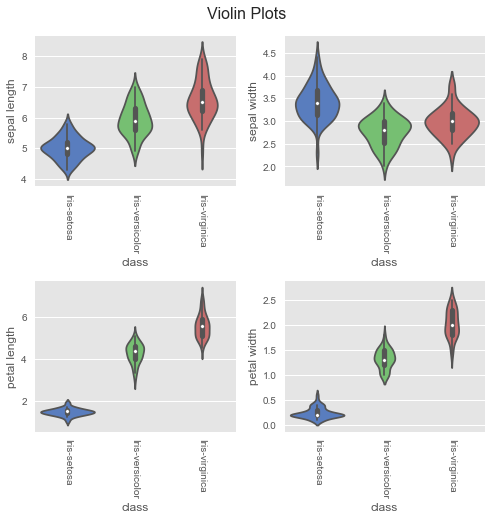
fig , ax= plt.subplots(2 , 2 , figsize = (7 , 7))
sns.set (style = 'white' ,palette = 'muted')
sns.violinplot(x = df['class'] , y = df['sepal length'] , ax = ax[0,0])
sns.violinplot(x = df['class'] , y = df['sepal width'] , ax = ax[0,1])
sns.violinplot(x = df['class'] , y = df['petal length'] , ax = ax[1,0])
sns.violinplot(x = df['class'] , y = df['petal width'] , ax = ax[1,1])
fig.suptitle('Violin Plots', fontsize = 16 , y = 1.03)
for i in ax.flat:
plt.setp(i.get_xticklabels() , rotation = -90)
fig.tight_layout()结果如下: